Project dashboard
Your view
The project dashboard is one project on one page: where it stands, who is doing what for the next 3 weeks, and the numbers behind the verdict.
1. Open the dashboard
Section titled “1. Open the dashboard”- Choose the project in the project switcher at the top of the sidebar.
- Open Work Area › Overview. Project dashboard is the first tab. Press Ctrl K (Windows) or ⌘ K (Mac), type Project dashboard, and press Enter. It opens in the page panel.
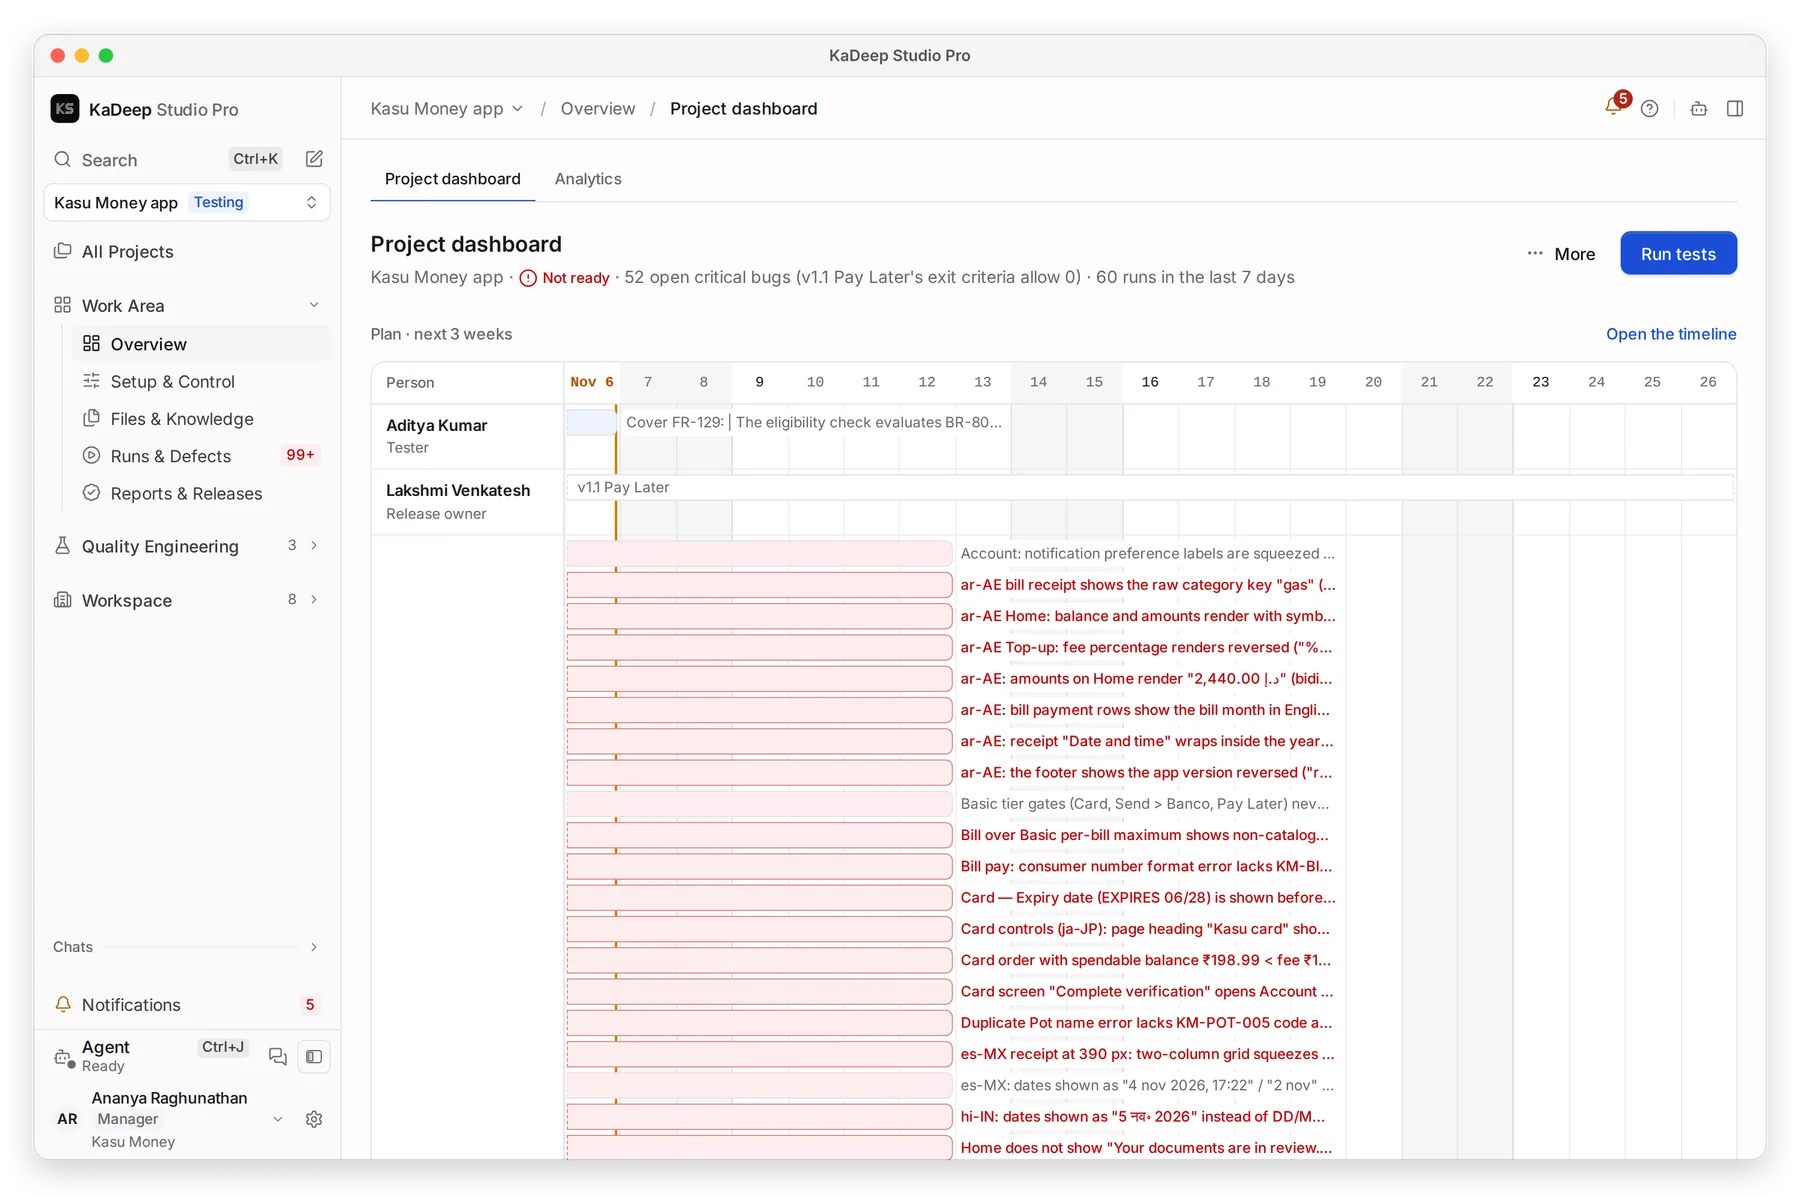
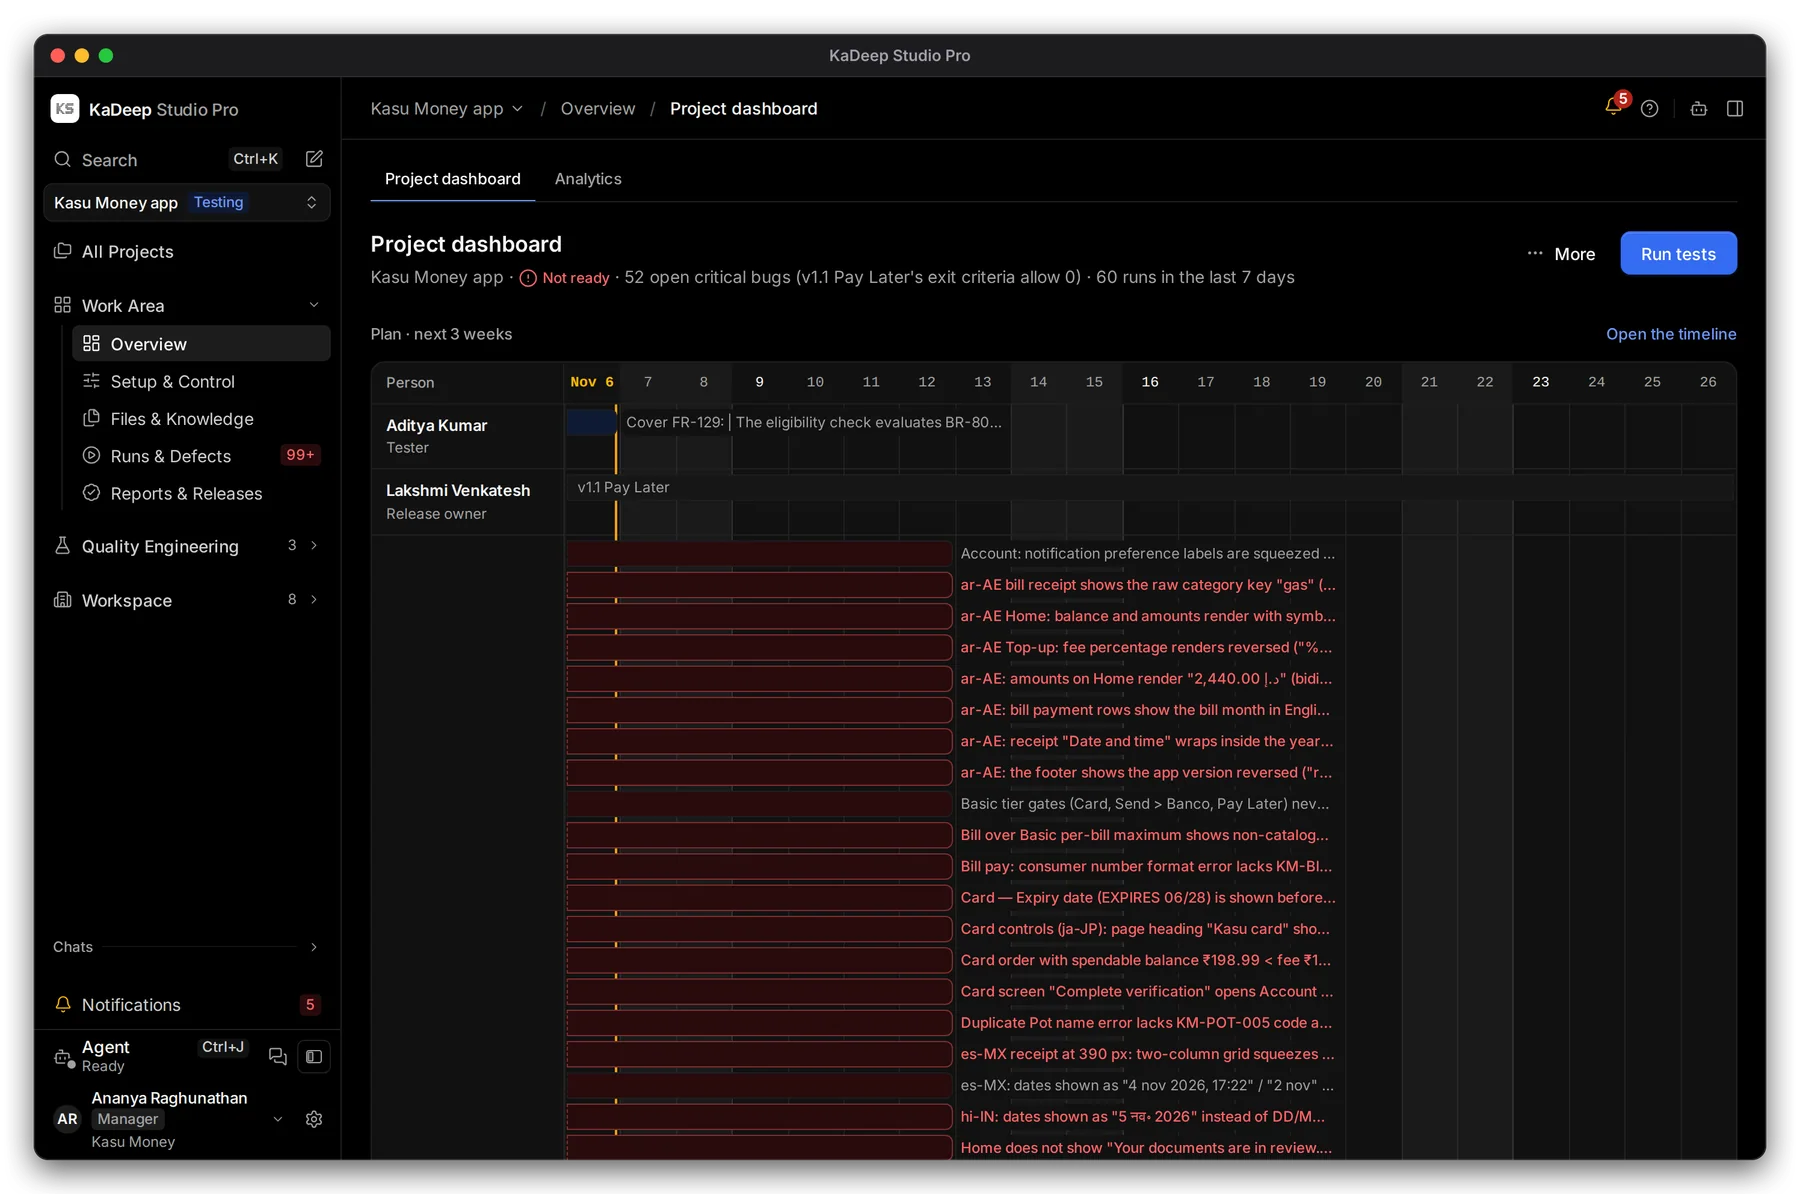
Manage view
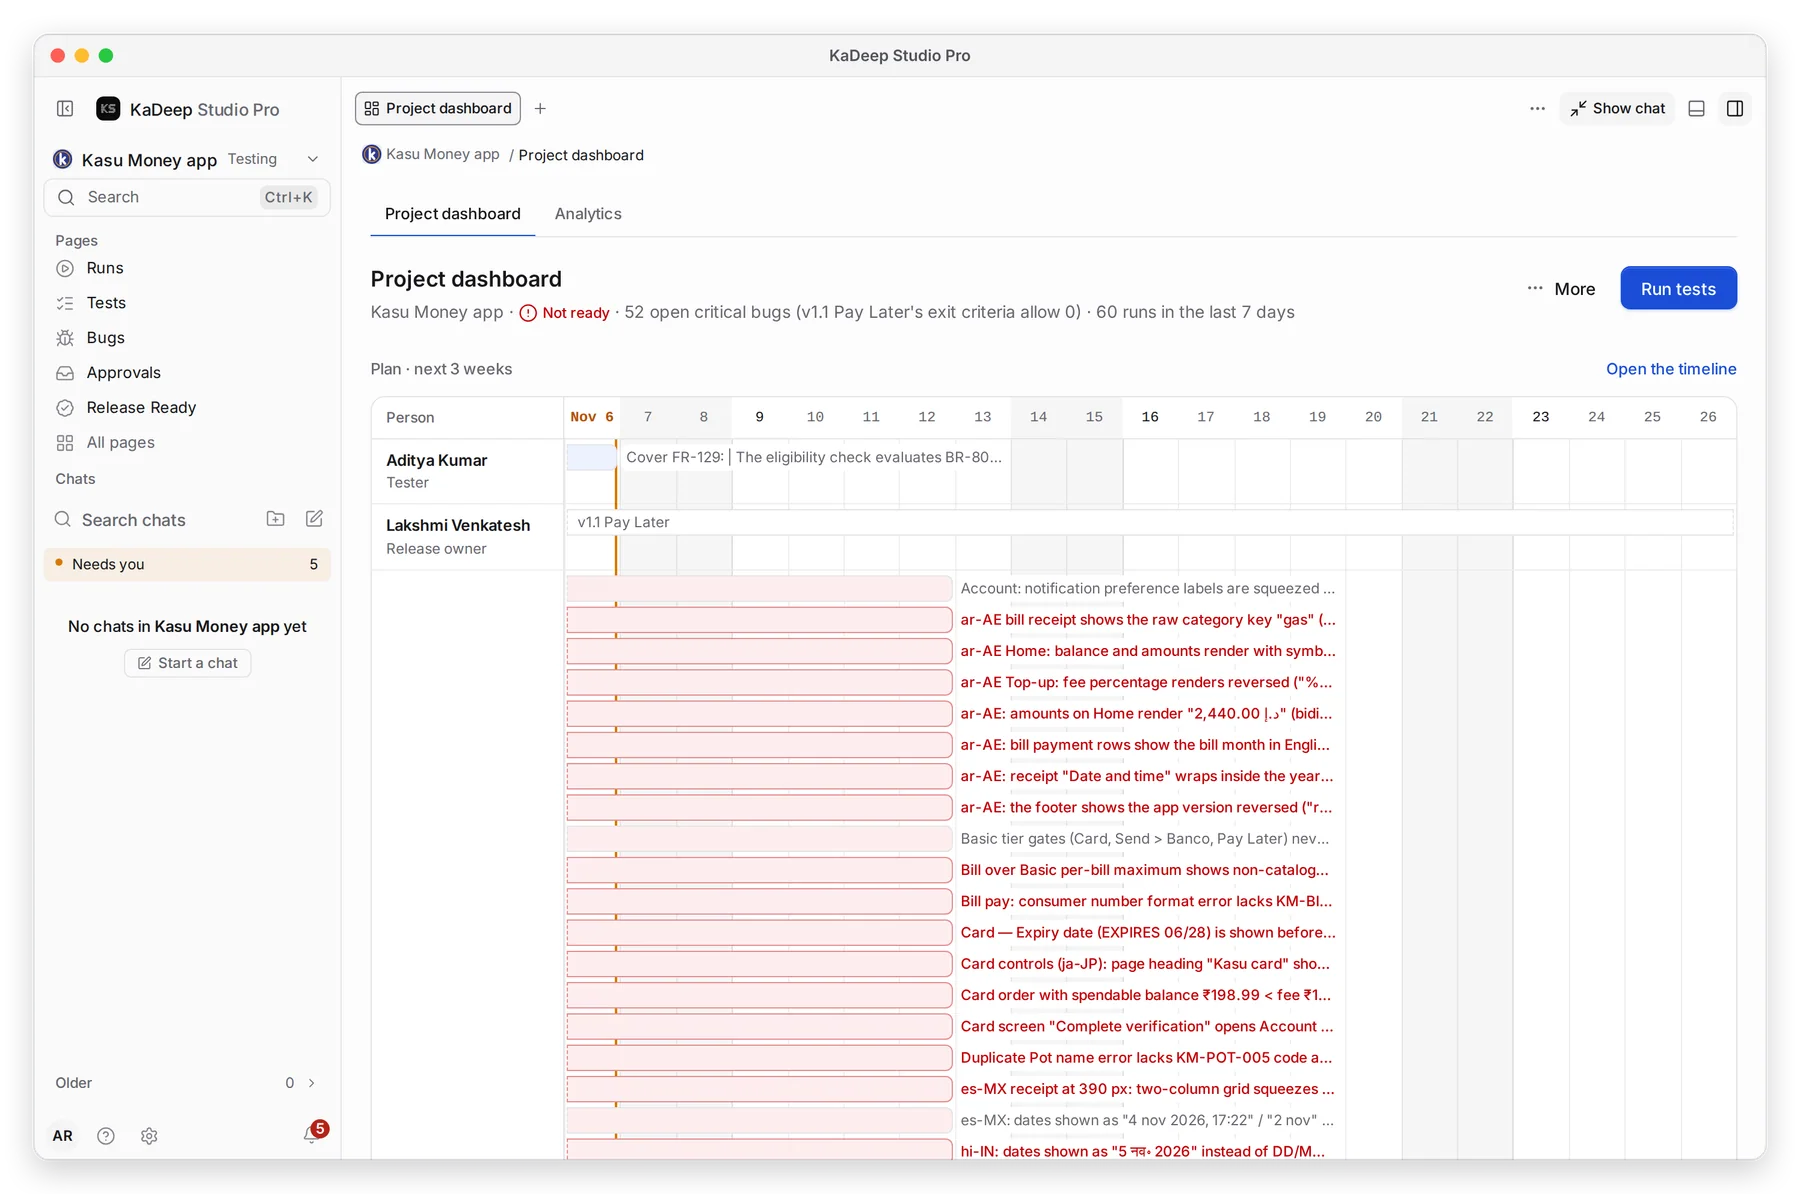
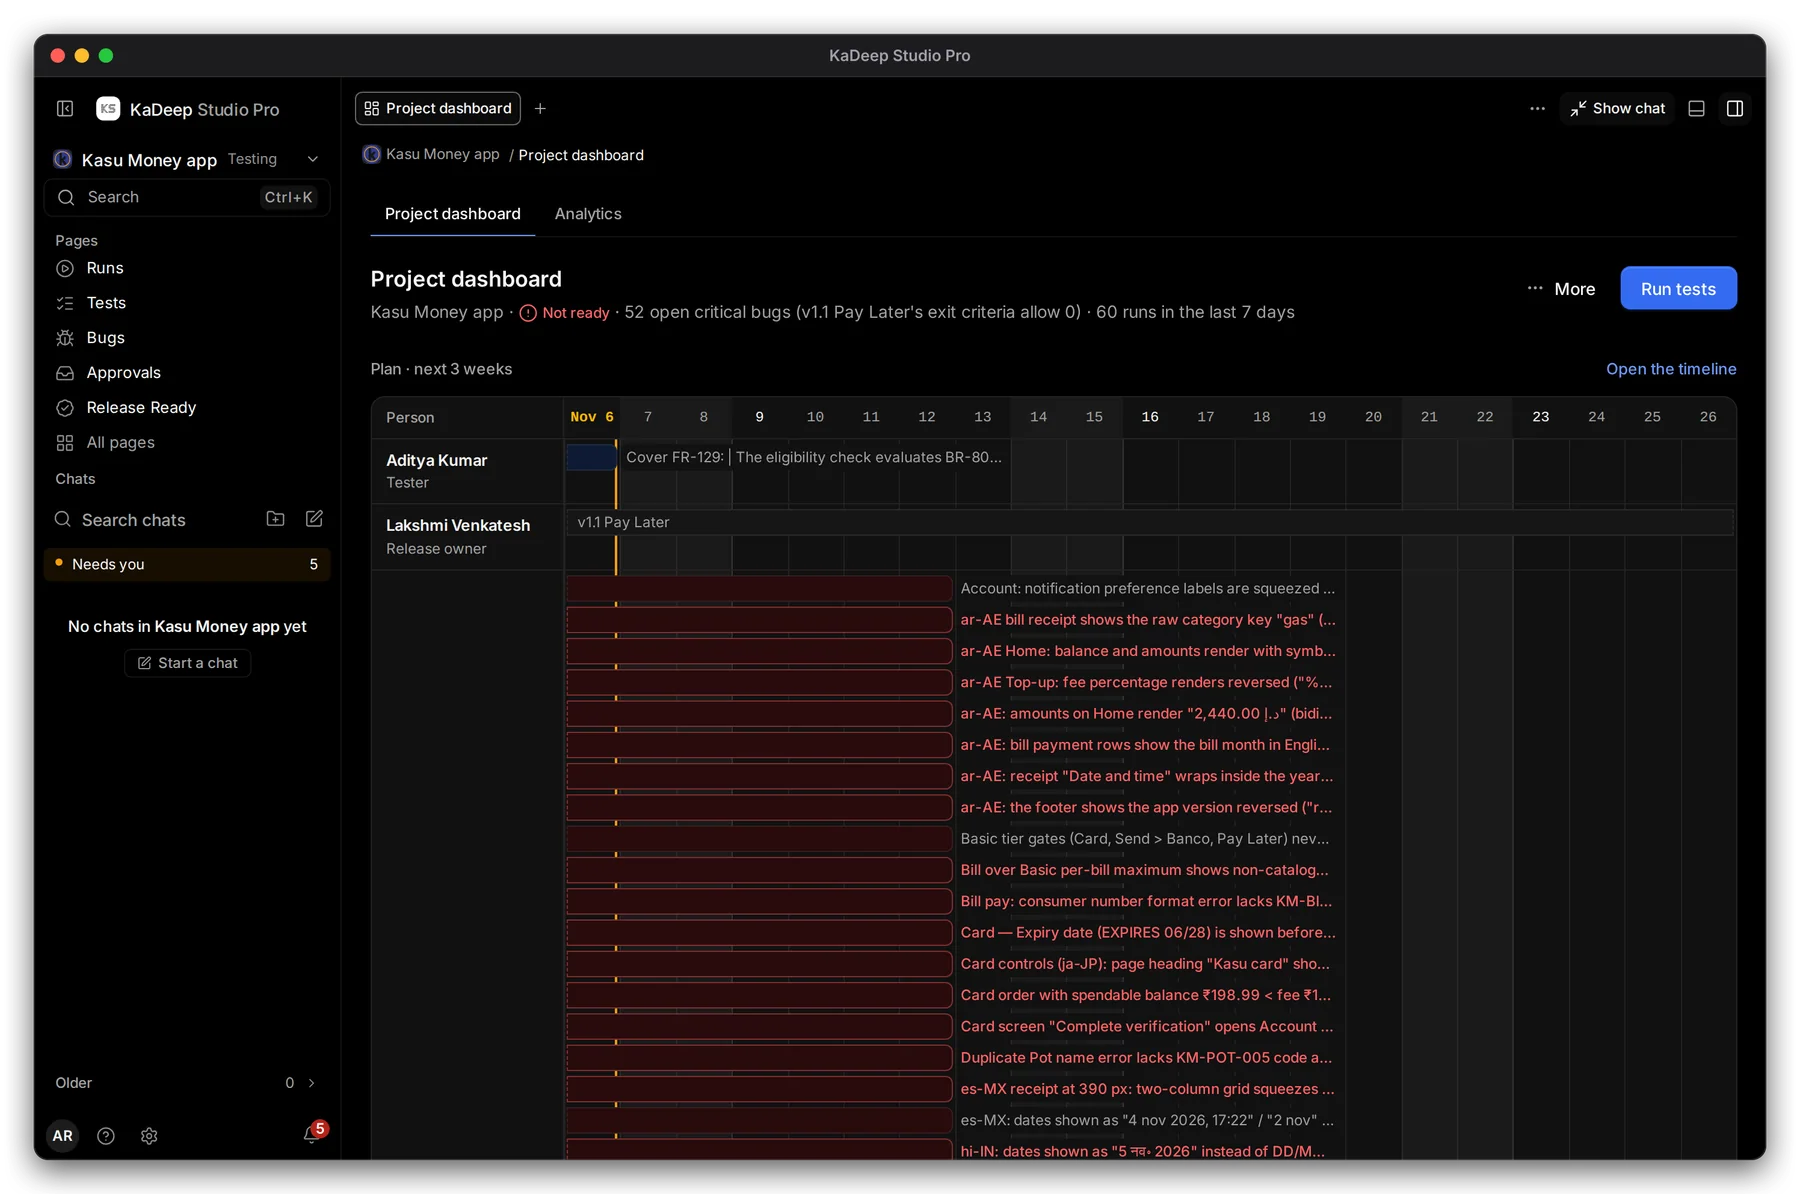
Hands-on view
- 1 The verdict in one line: Ready or not, the main reason, and runs in the last 7 days.
- 2 Plan · next 3 weeks: each person’s tasks and bugs with a due date, on a calendar.
- 3 The release owner’s row shows the release window.
- 4 Open the timeline shows the same plan across all your projects. See Timeline.
2. Read the numbers
Section titled “2. Read the numbers”Scroll below the plan.
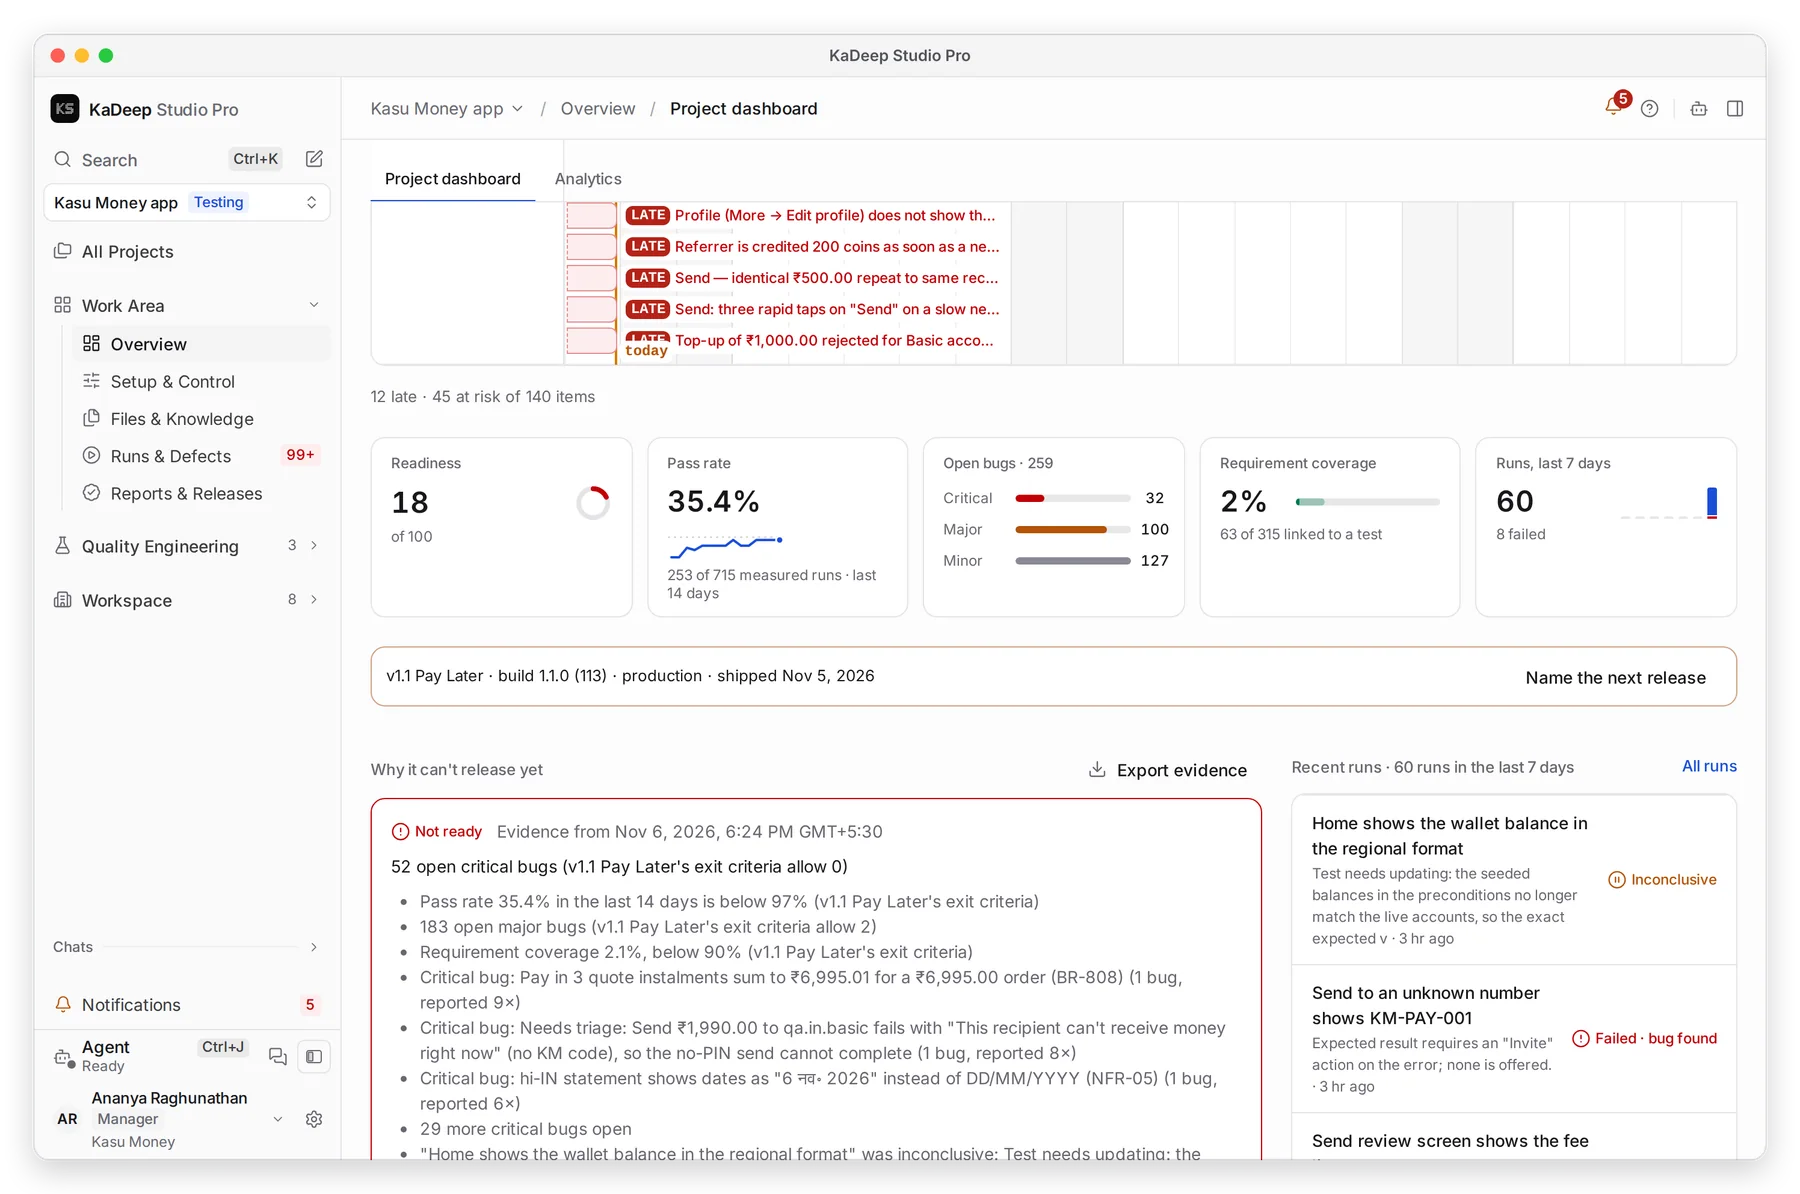
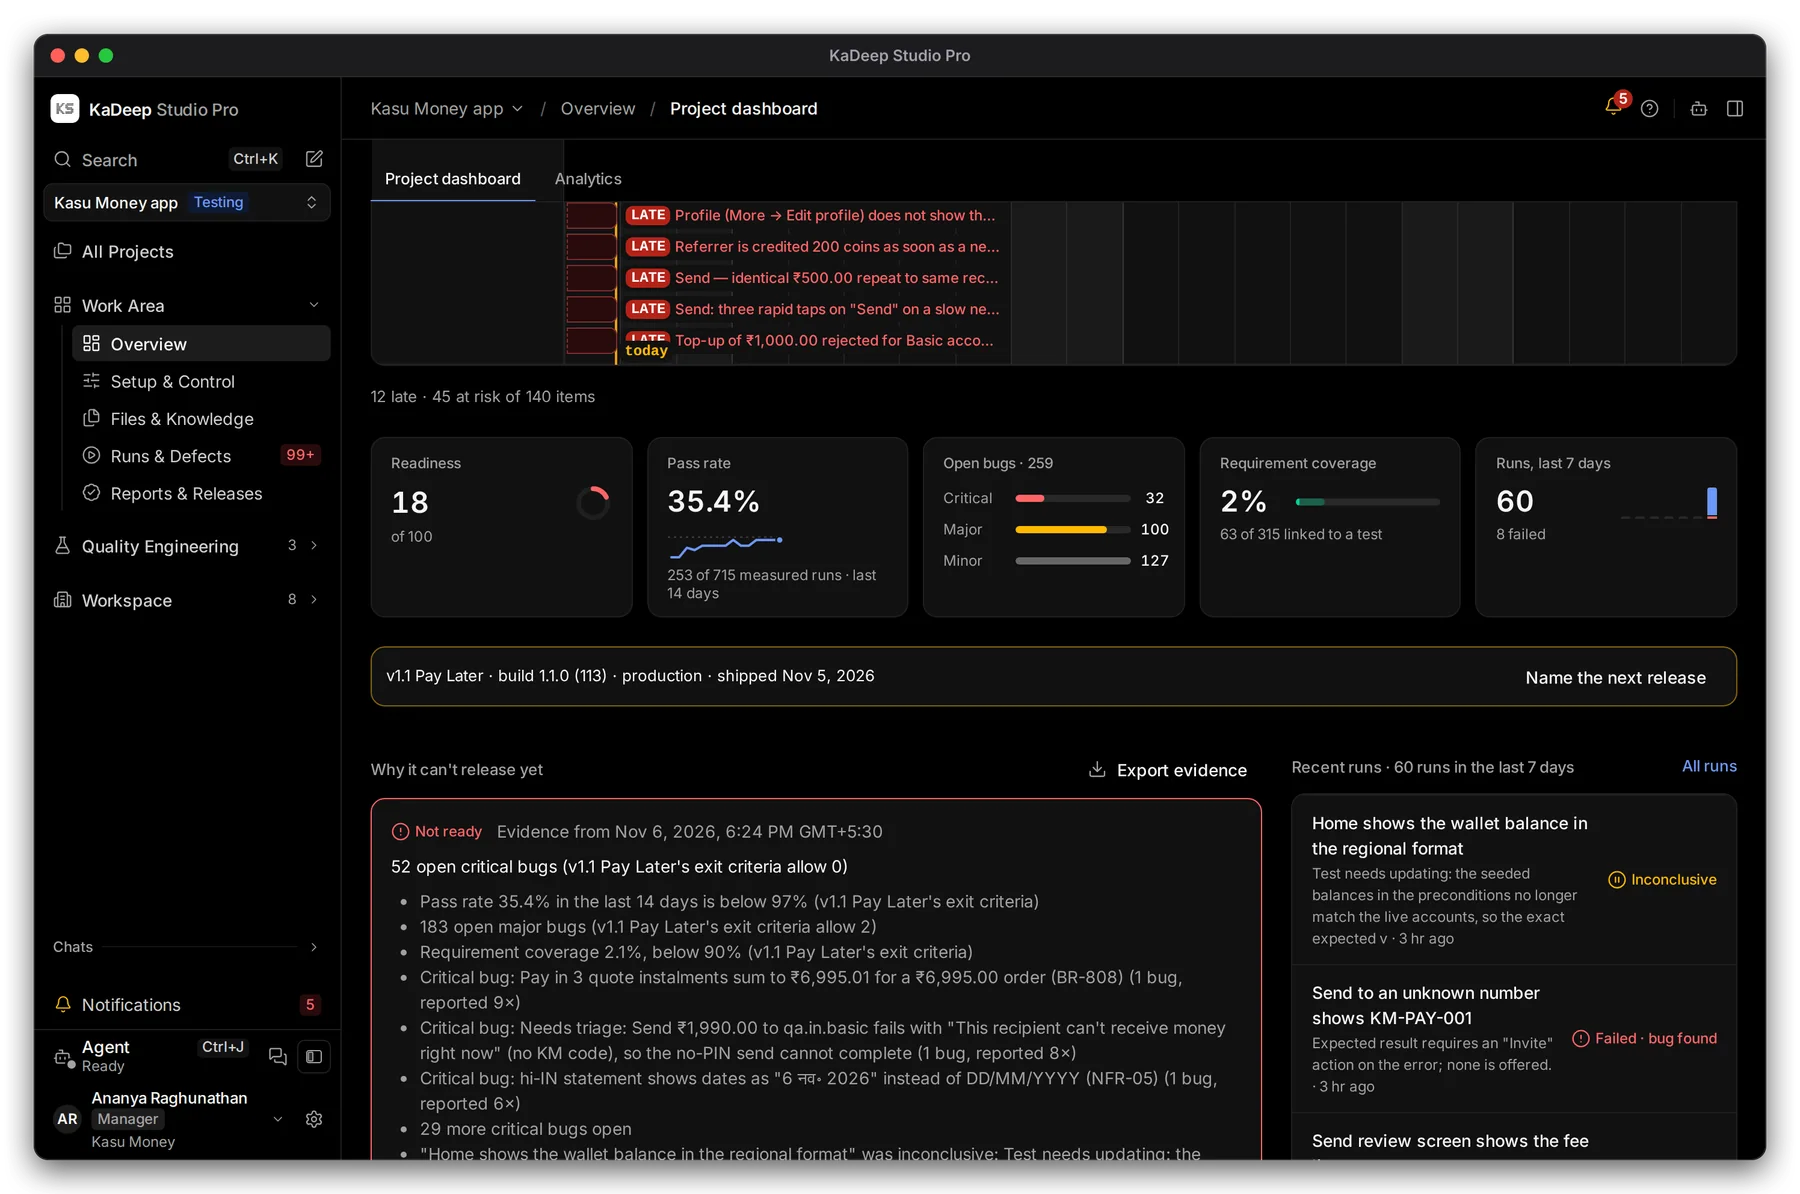
Manage view
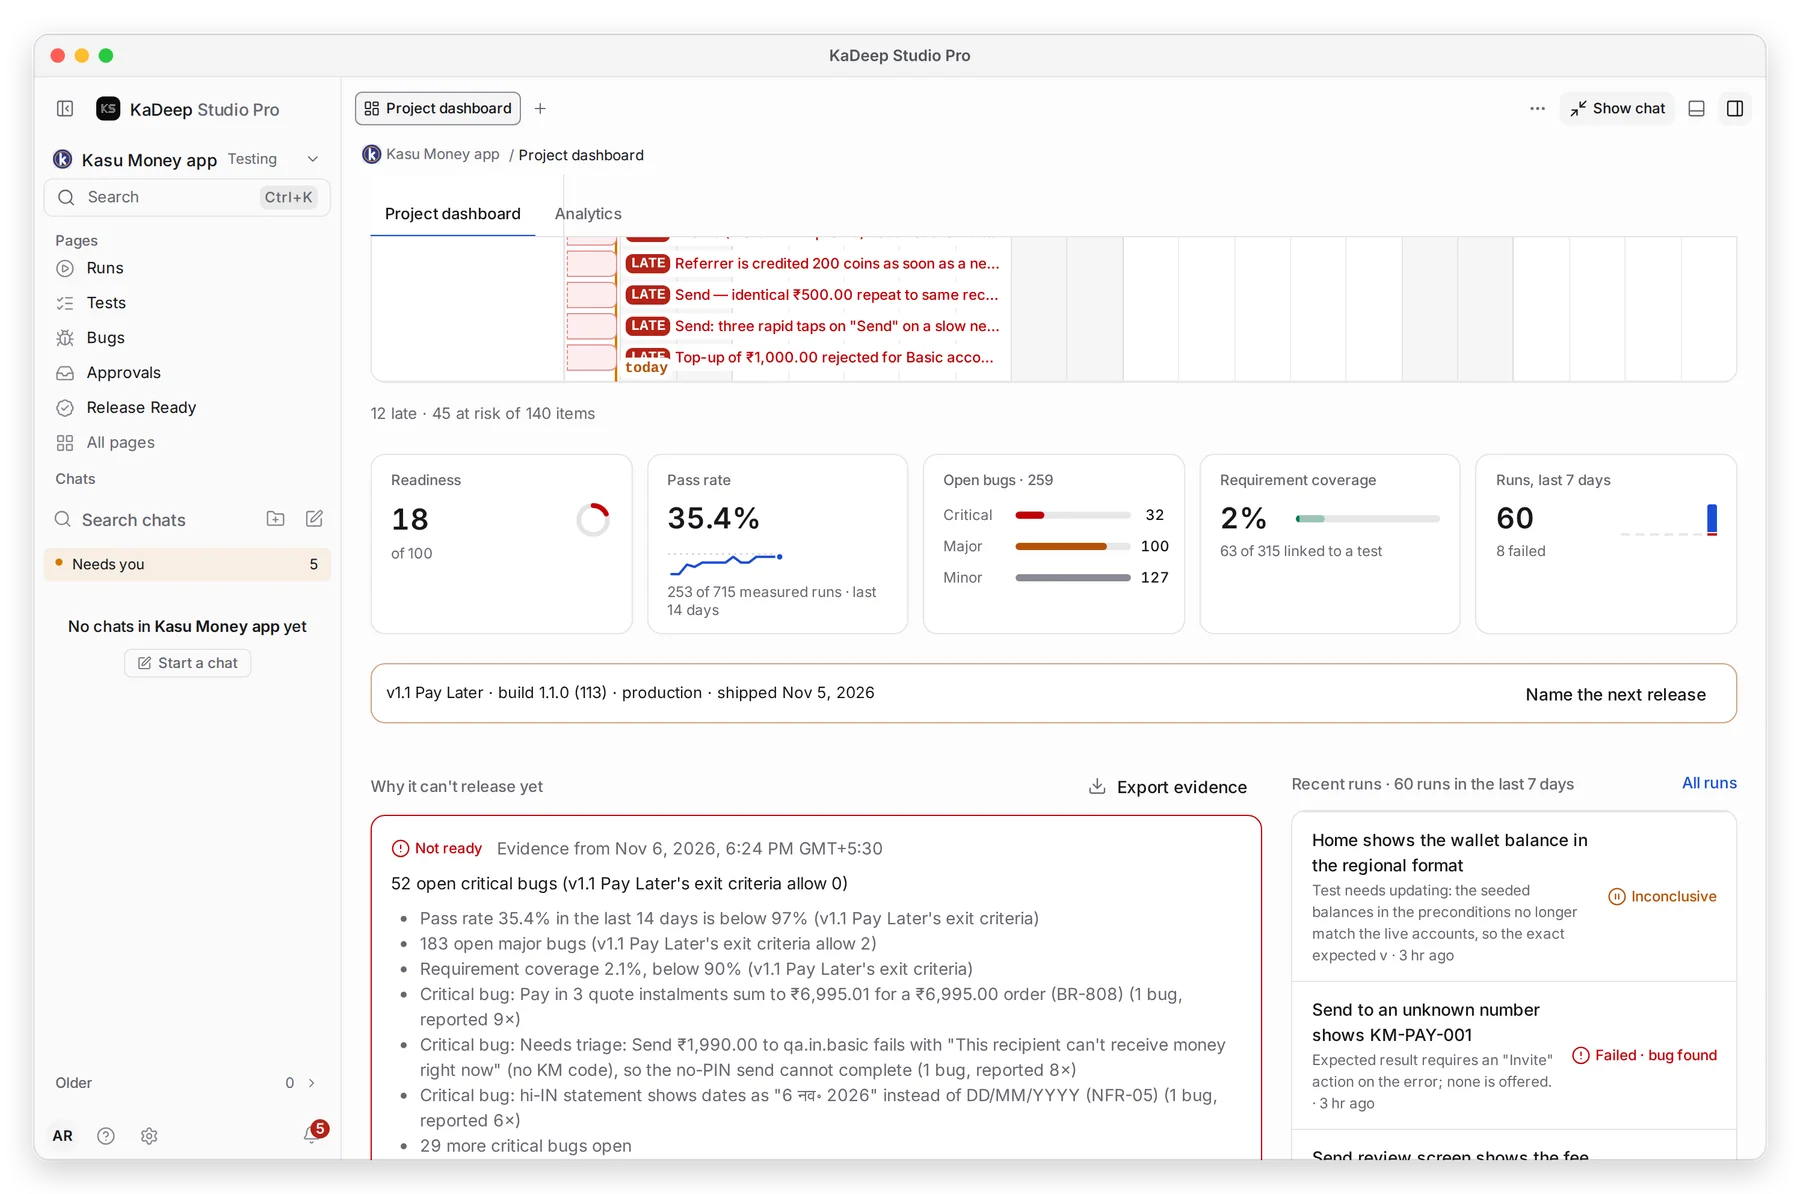
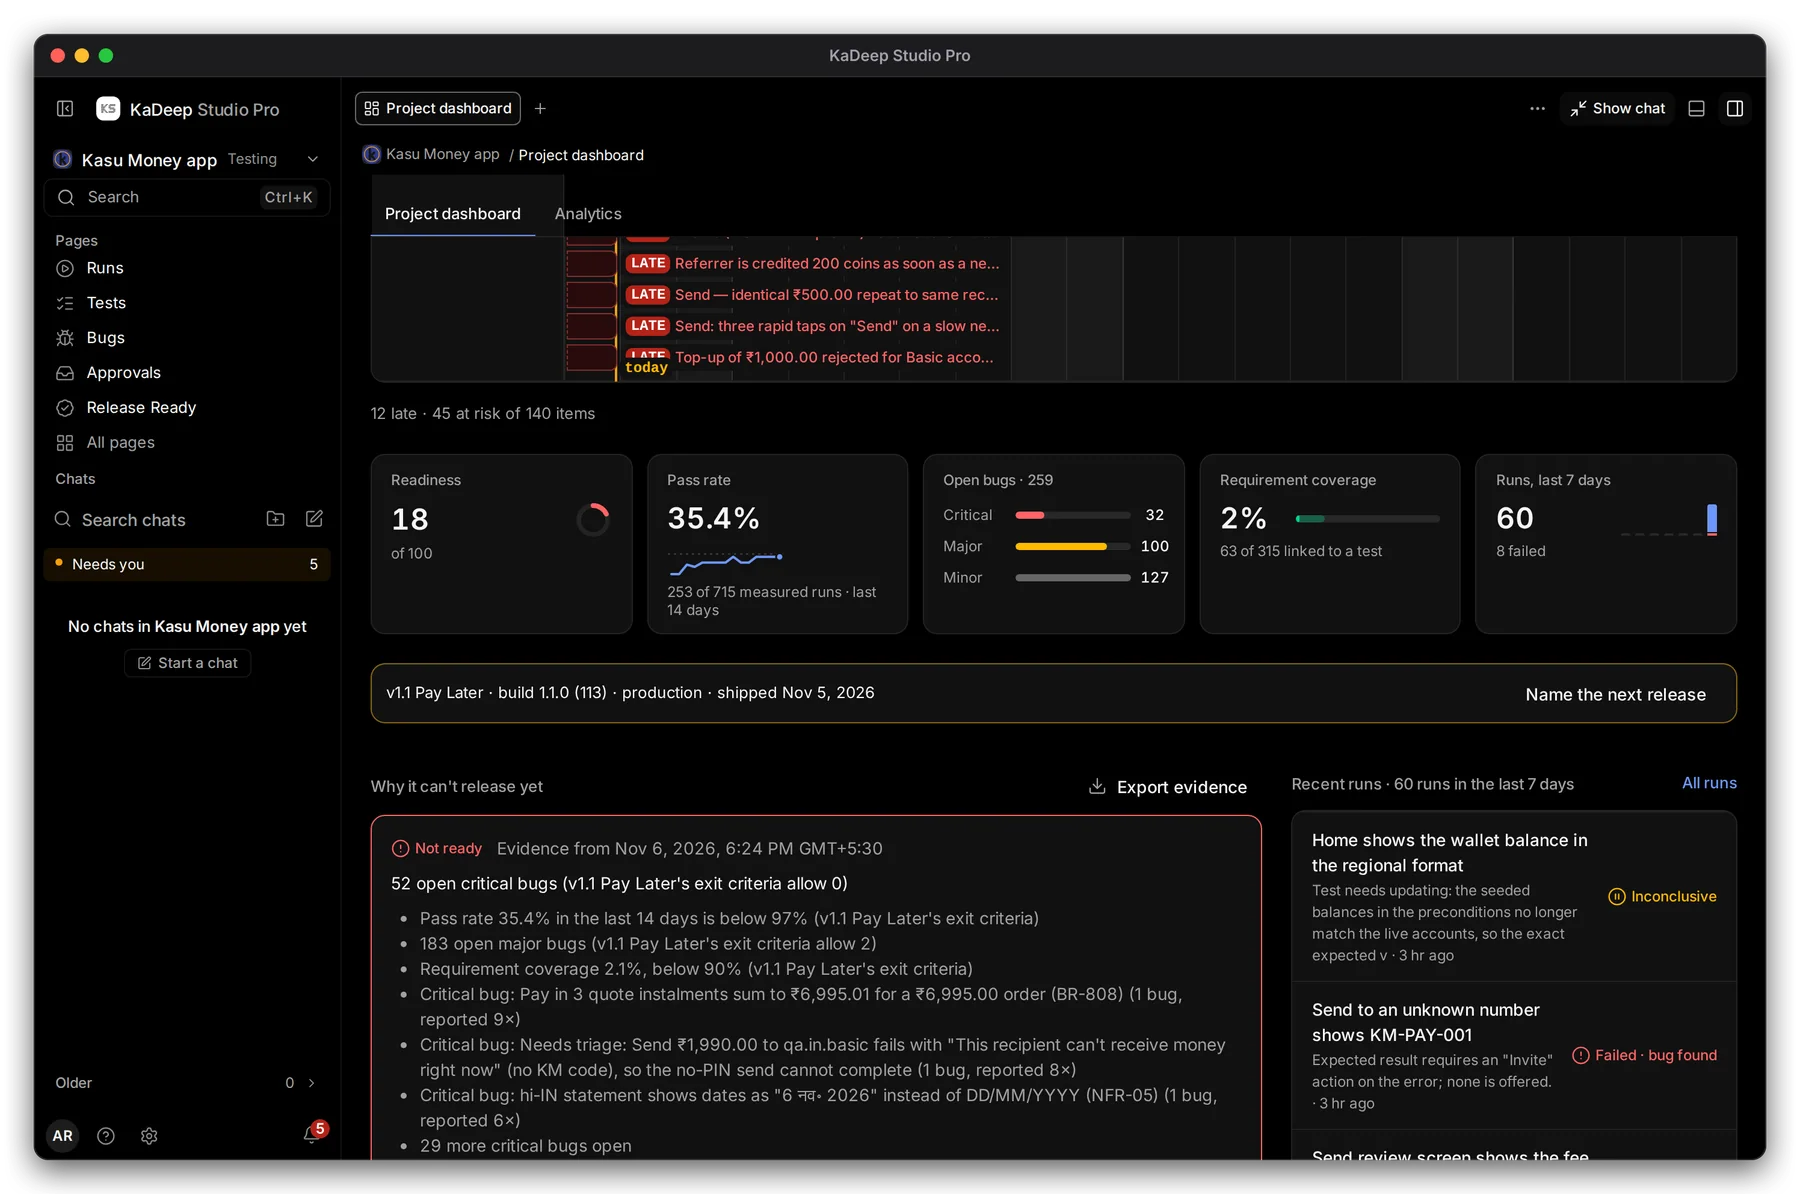
Hands-on view
- 1 Readiness, a score out of 100. Also in the strip: Pass rate, Requirement coverage, and Runs, last 7 days.
- 2 Open bugs, split into Critical, Major and Minor.
- 3 The release: its name, build and environment.
- 4 Why: every reason behind the verdict, with the date of the evidence.
On the right, Recent runs lists the latest runs with their results, and People on it shows who works on this project now.
Run tests at the top right starts a run. Runs count toward your budget.
What’s next
Section titled “What’s next”AnalyticsTrends, criteria, coverage and sign-offs.
Release ReadyDecide: hold, ship, or ship with accepted risk.
BugsTriage what the agent found.
TimelineAll handed-out work, by person.