Monitoring and reliability
Your view
Two pages tell you whether testing itself is healthy. Live ops is the now: what runs, what it costs, what errors. Reliability is the trend: which tools fail, which tests are flaky or slow.
1. Live ops: right now
Section titled “1. Live ops: right now”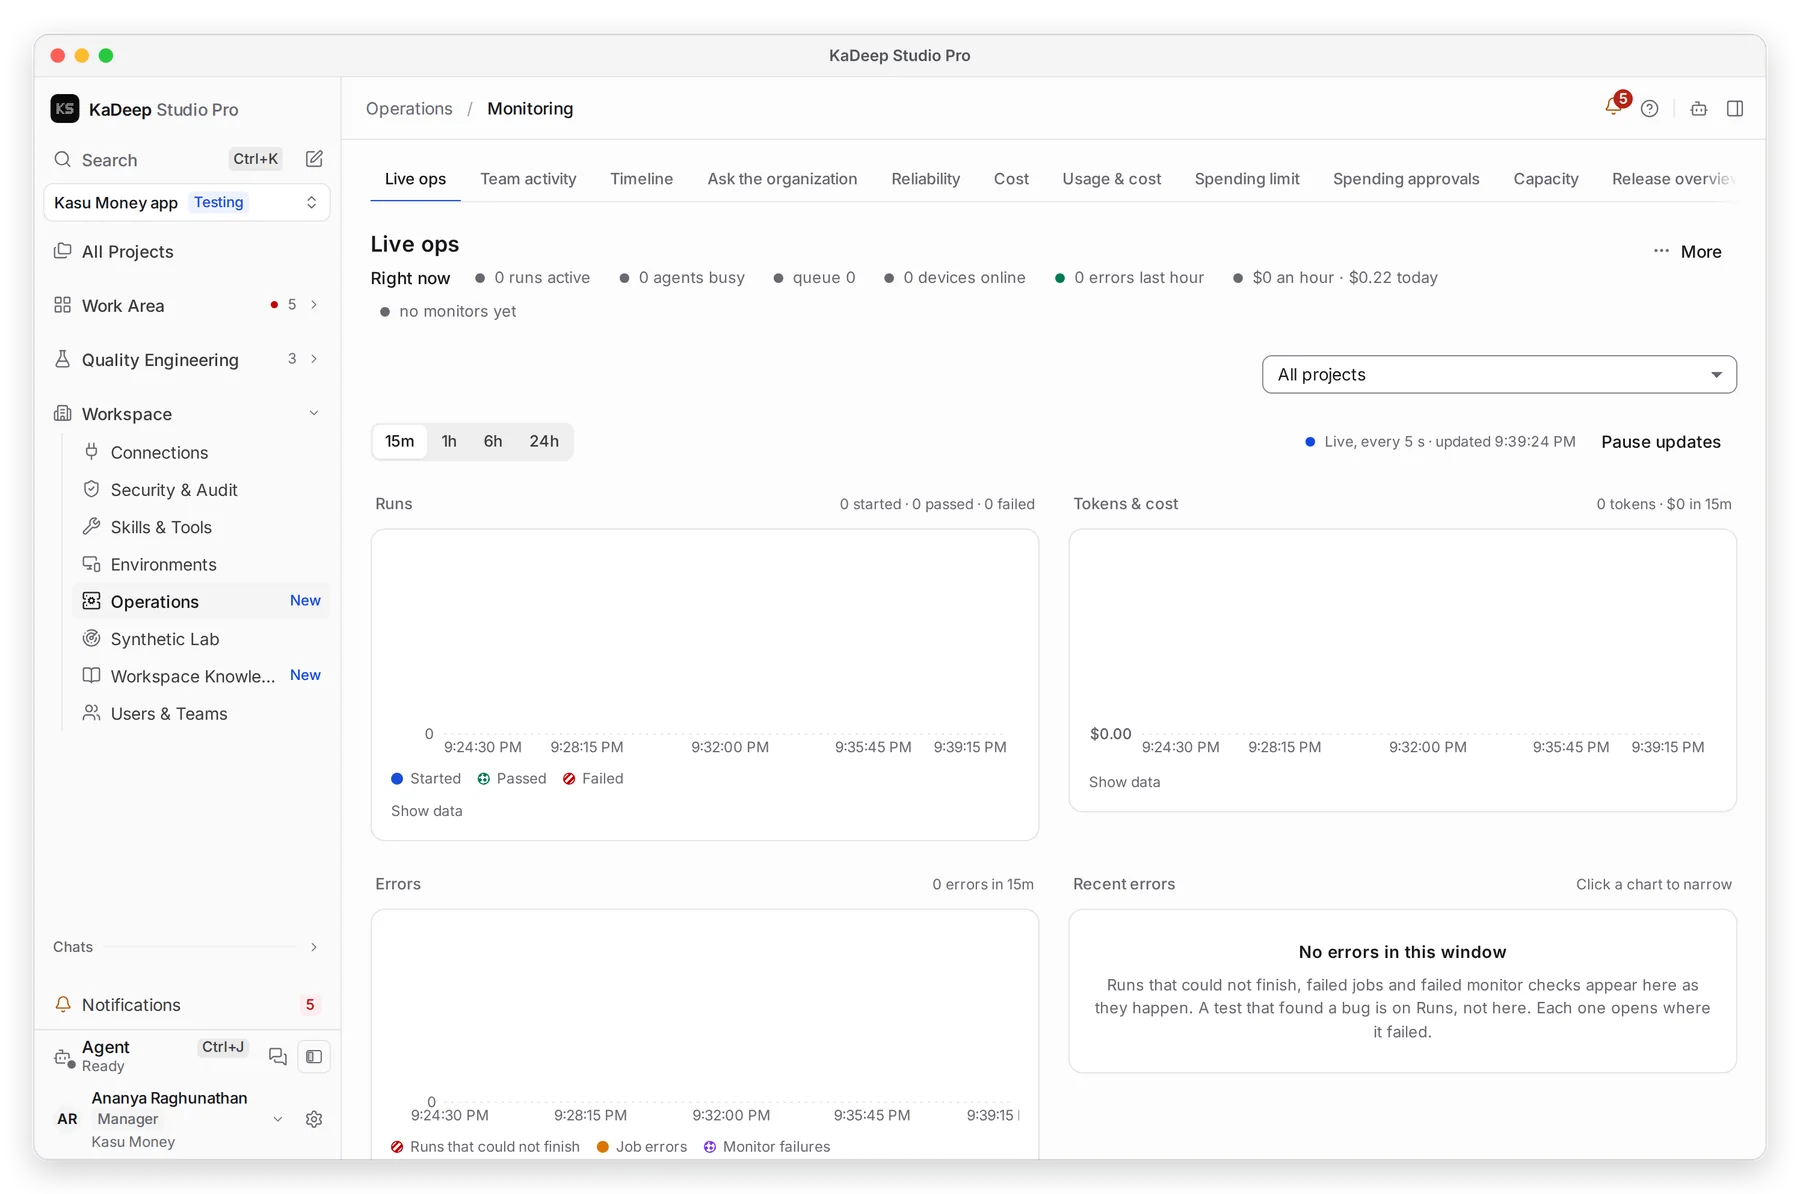
Manage view
Hands-on view
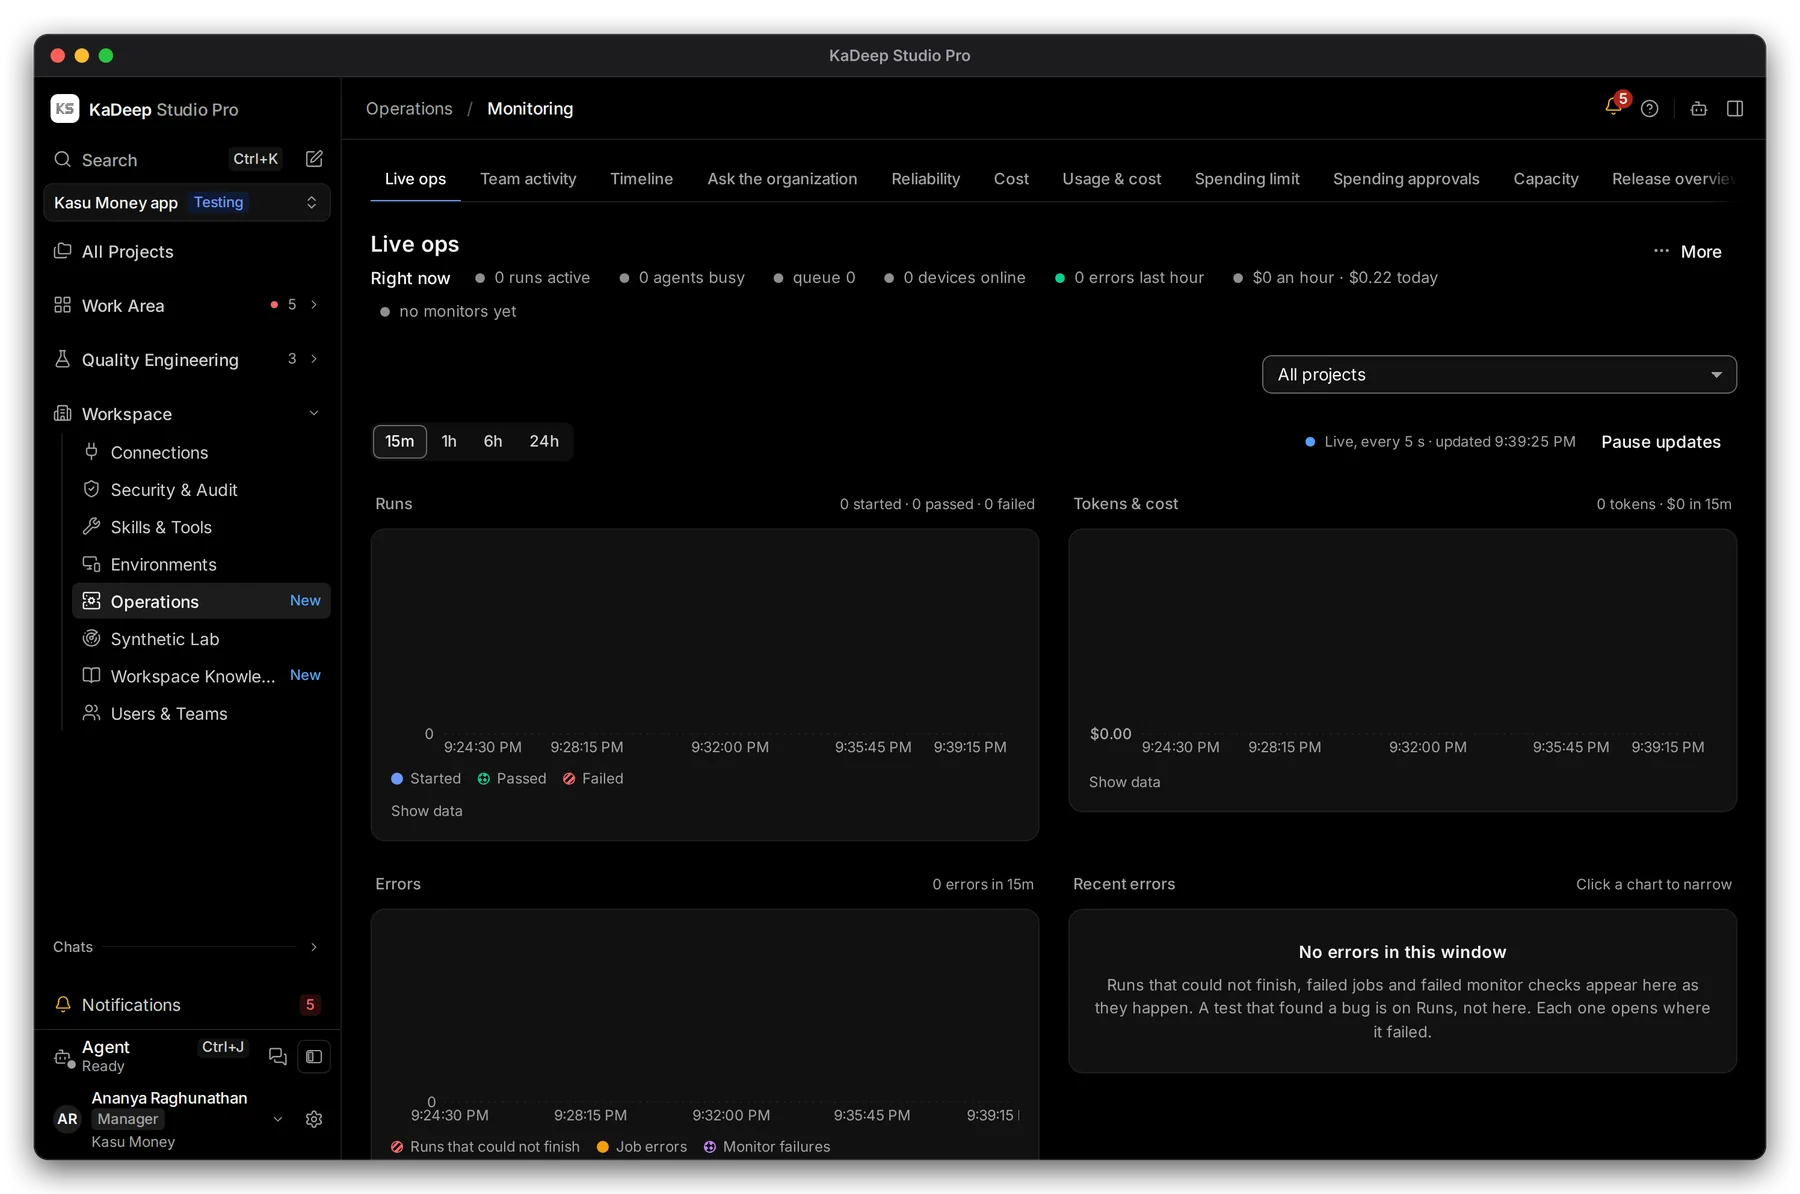
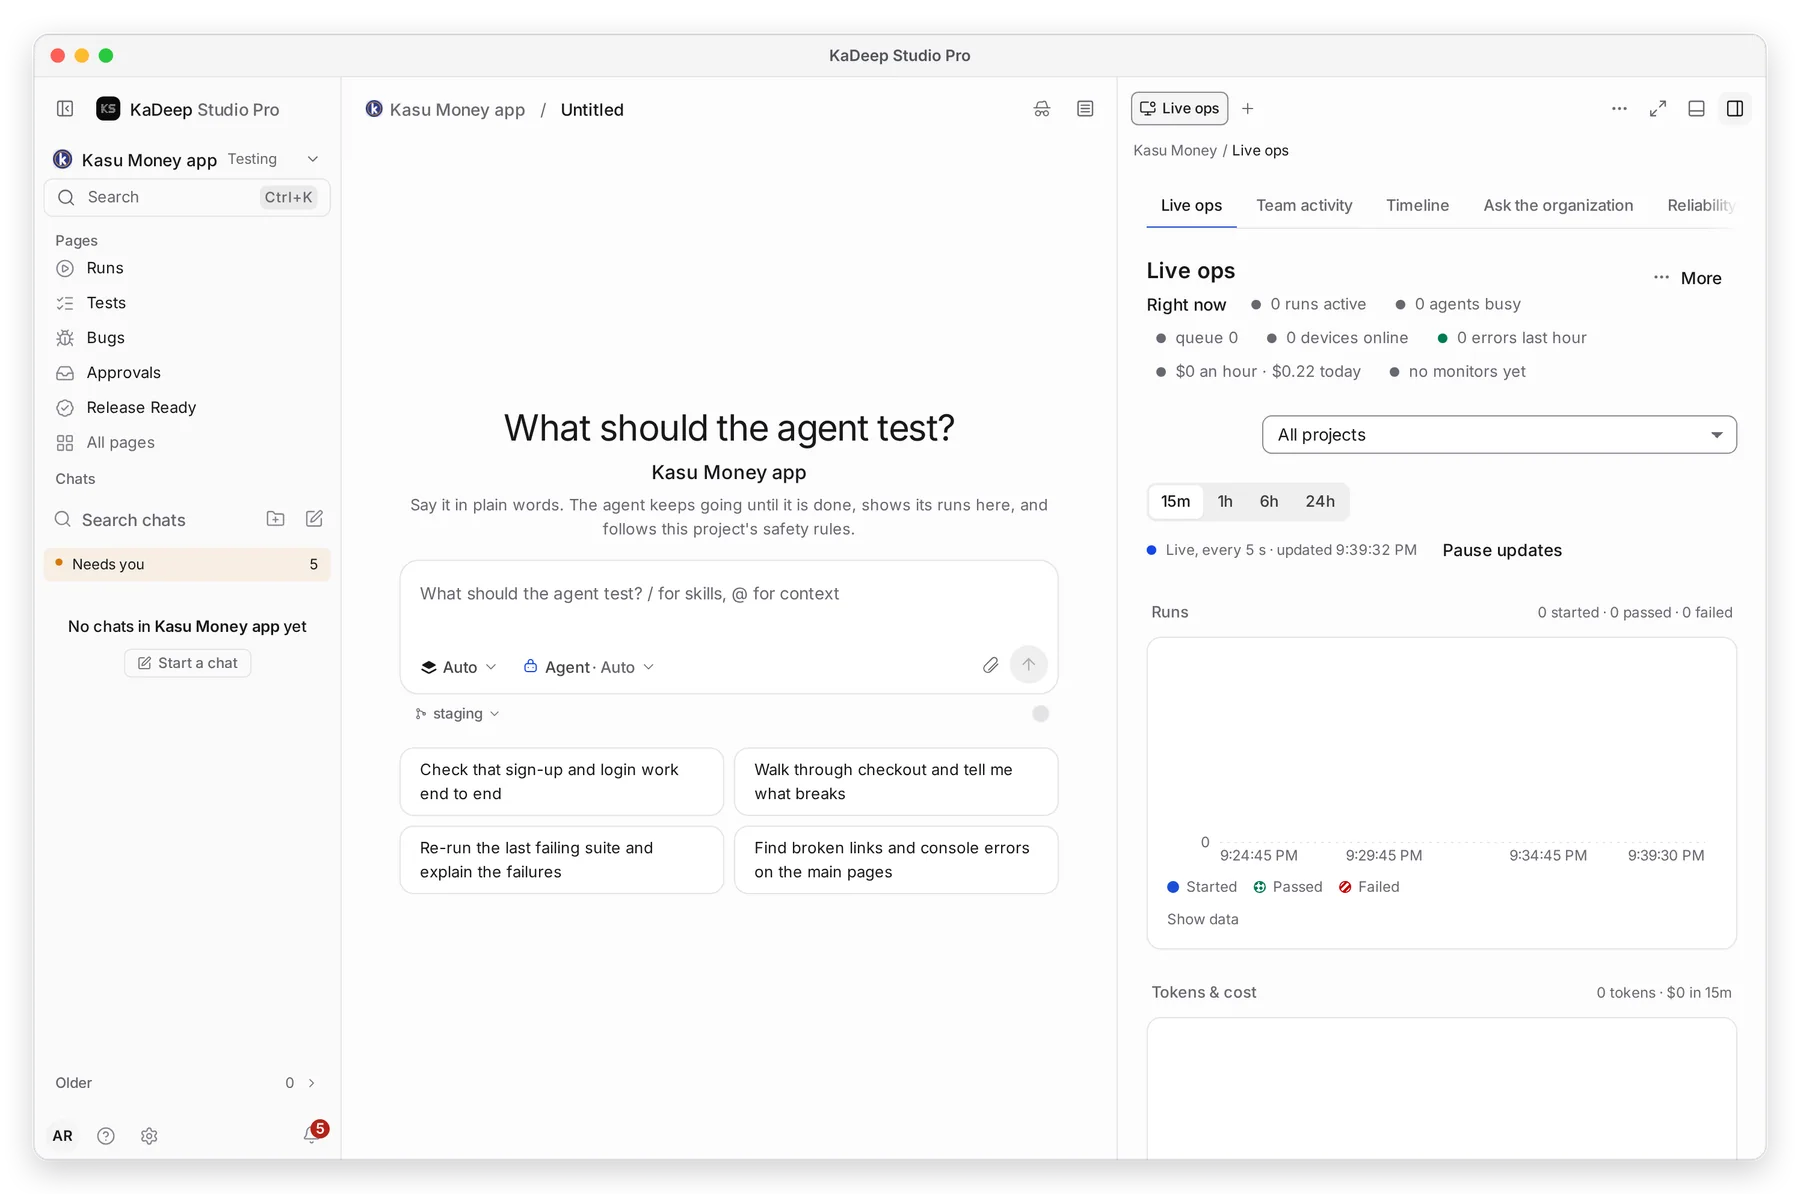
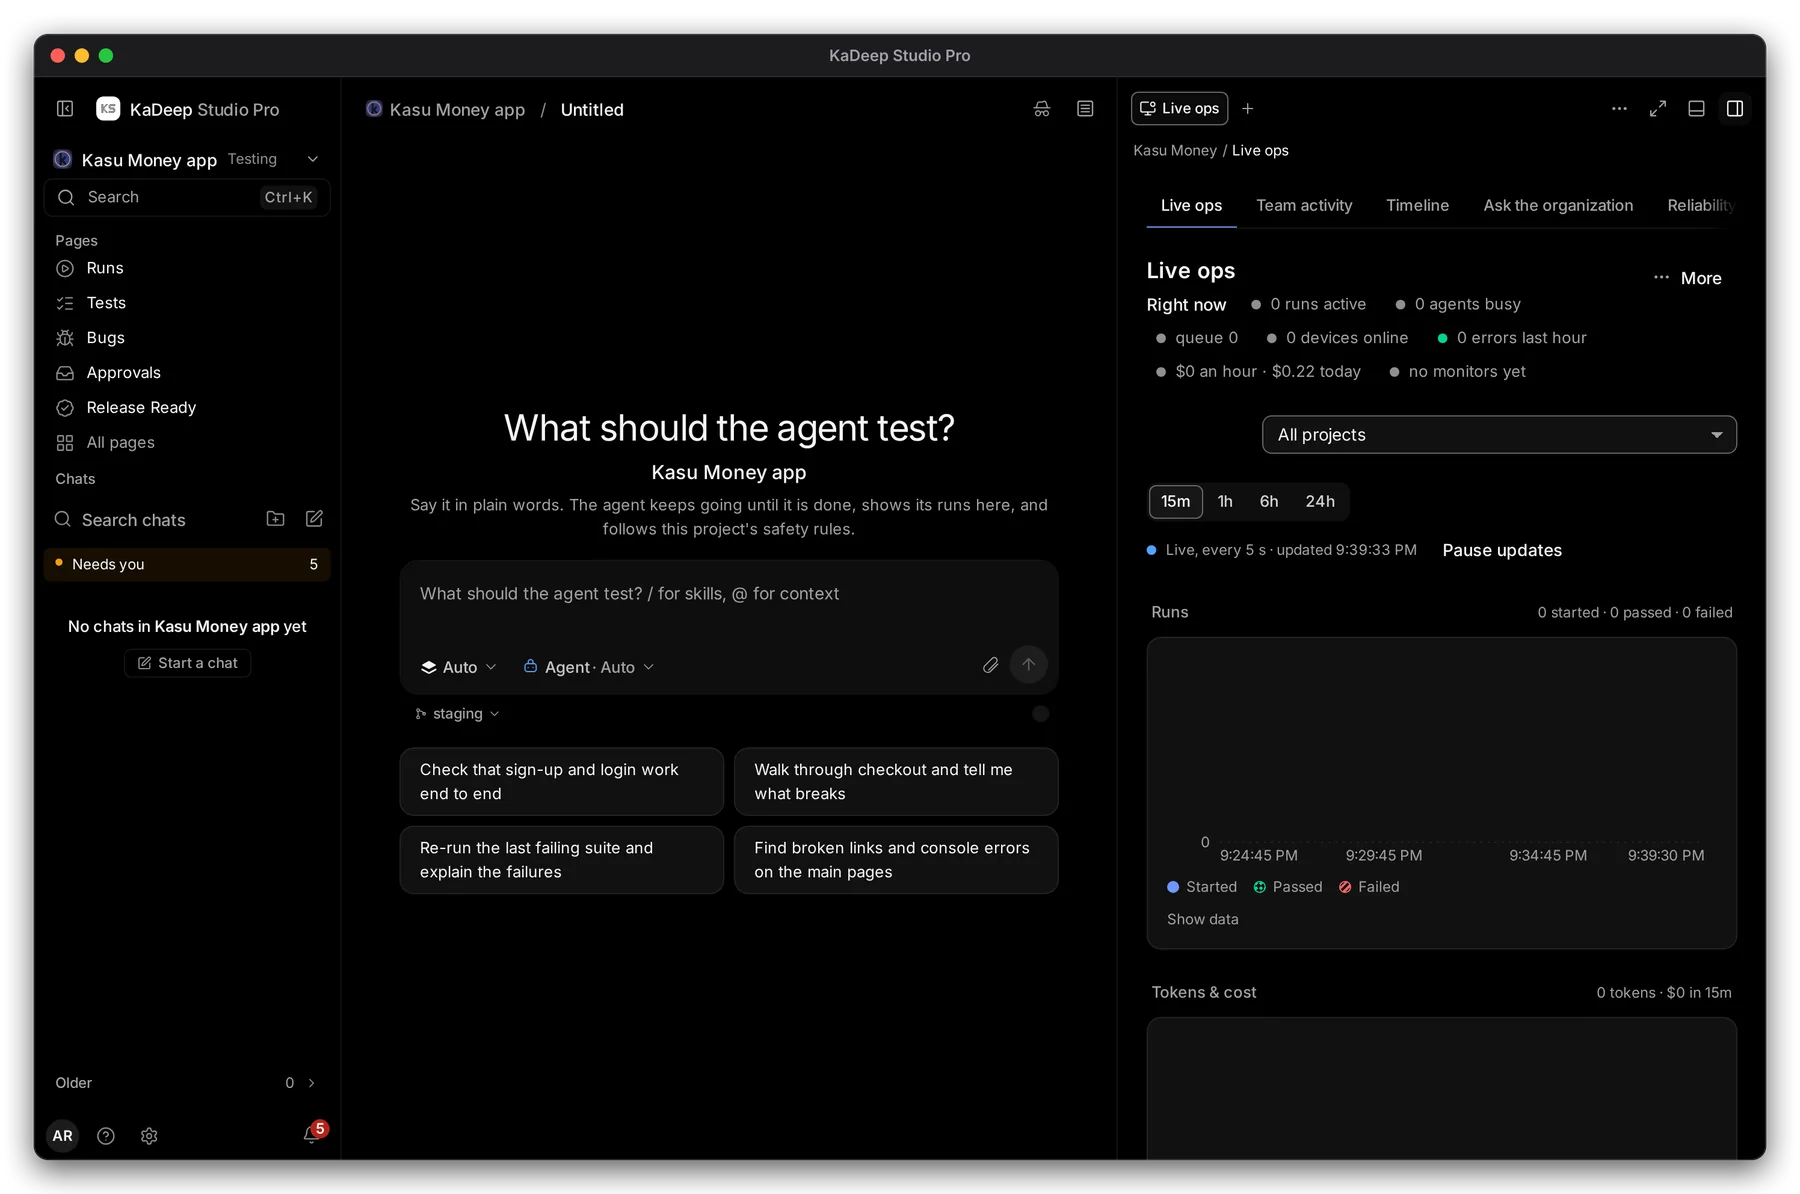
- 1 Right now: runs active, agents busy, the queue, devices online, errors in the last hour, cost per hour and today, and monitors.
- 2 The window for the charts: 15m, 1h, 6h or 24h. Narrow it to one project with Project.
- 3 The page updates every 5 seconds. Pause updates freezes it while you read.
The charts below show runs started, passed and failed, and tokens and cost, over the window. Show data lists the numbers behind a chart.
2. Reliability: the trend
Section titled “2. Reliability: the trend”Choose the Reliability tab.
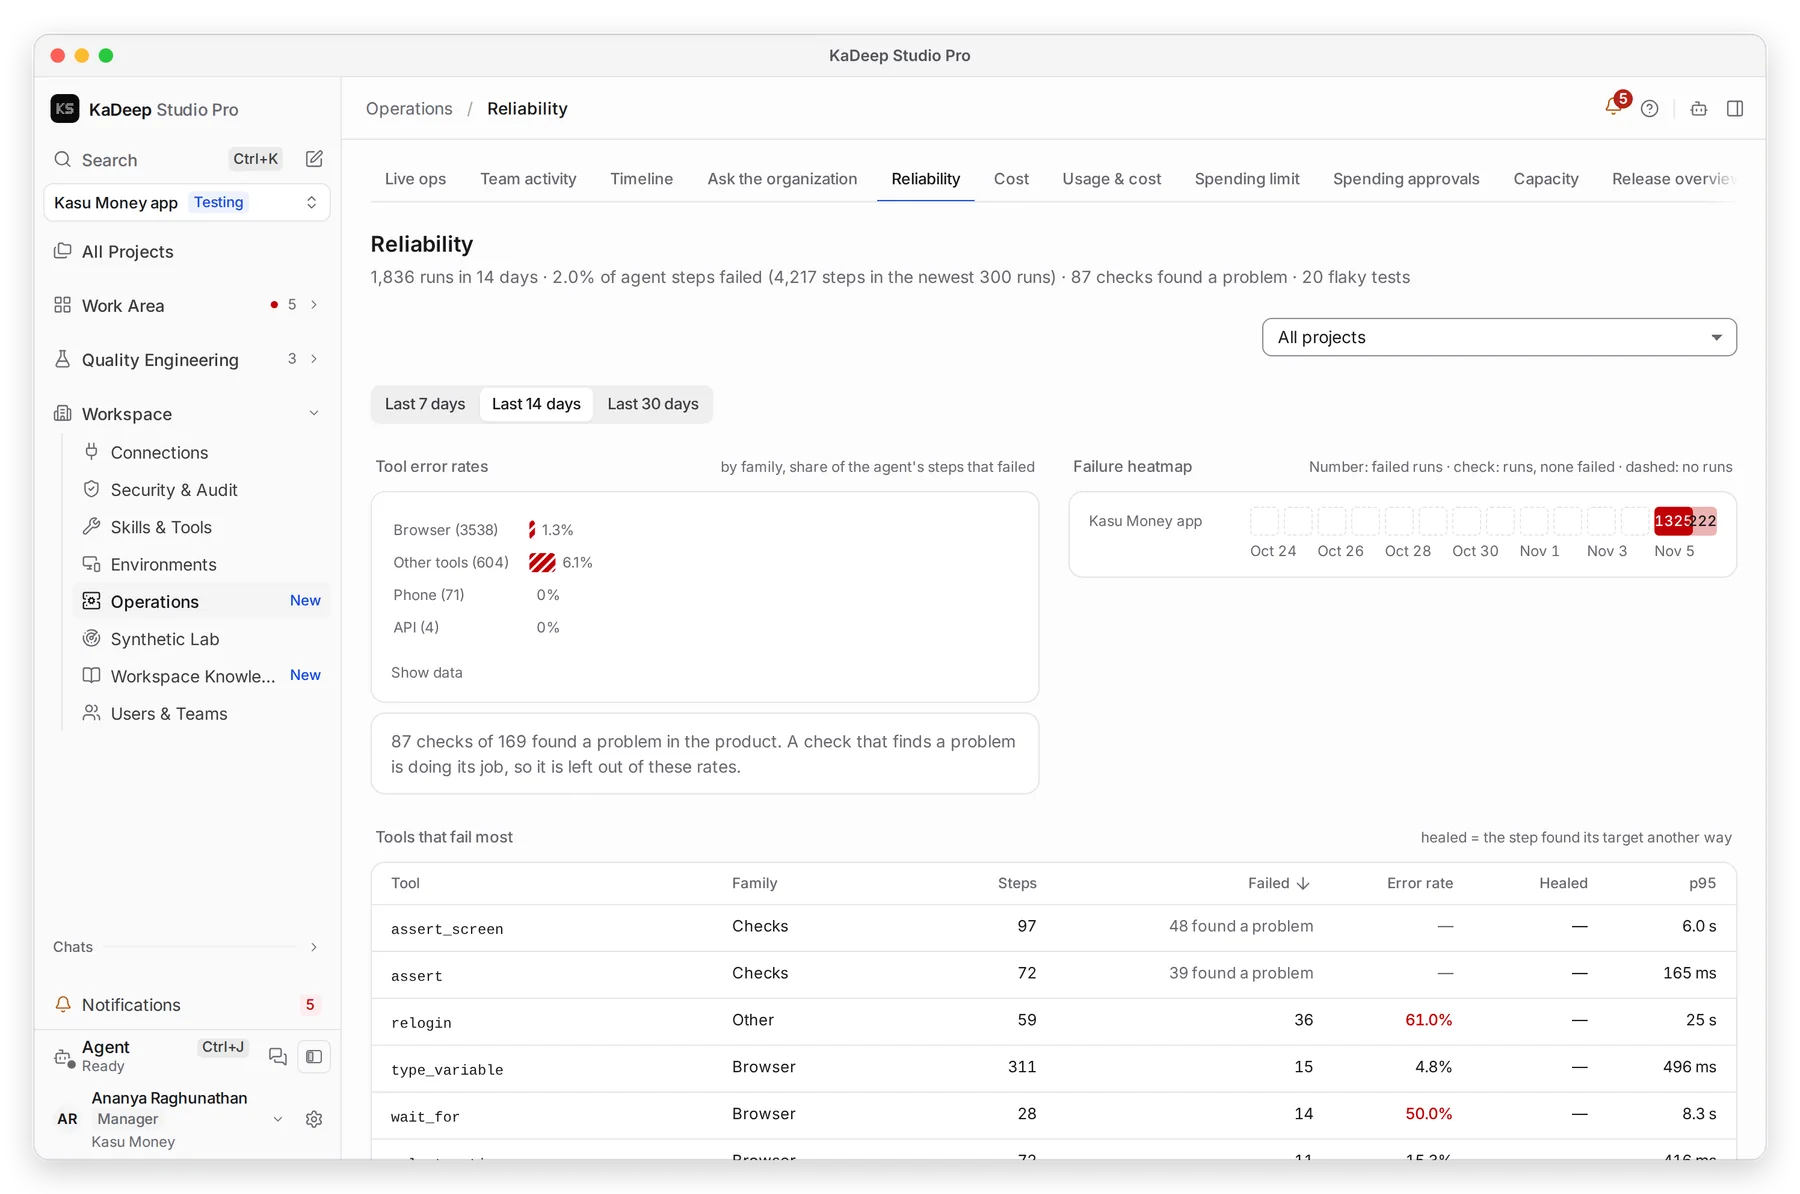
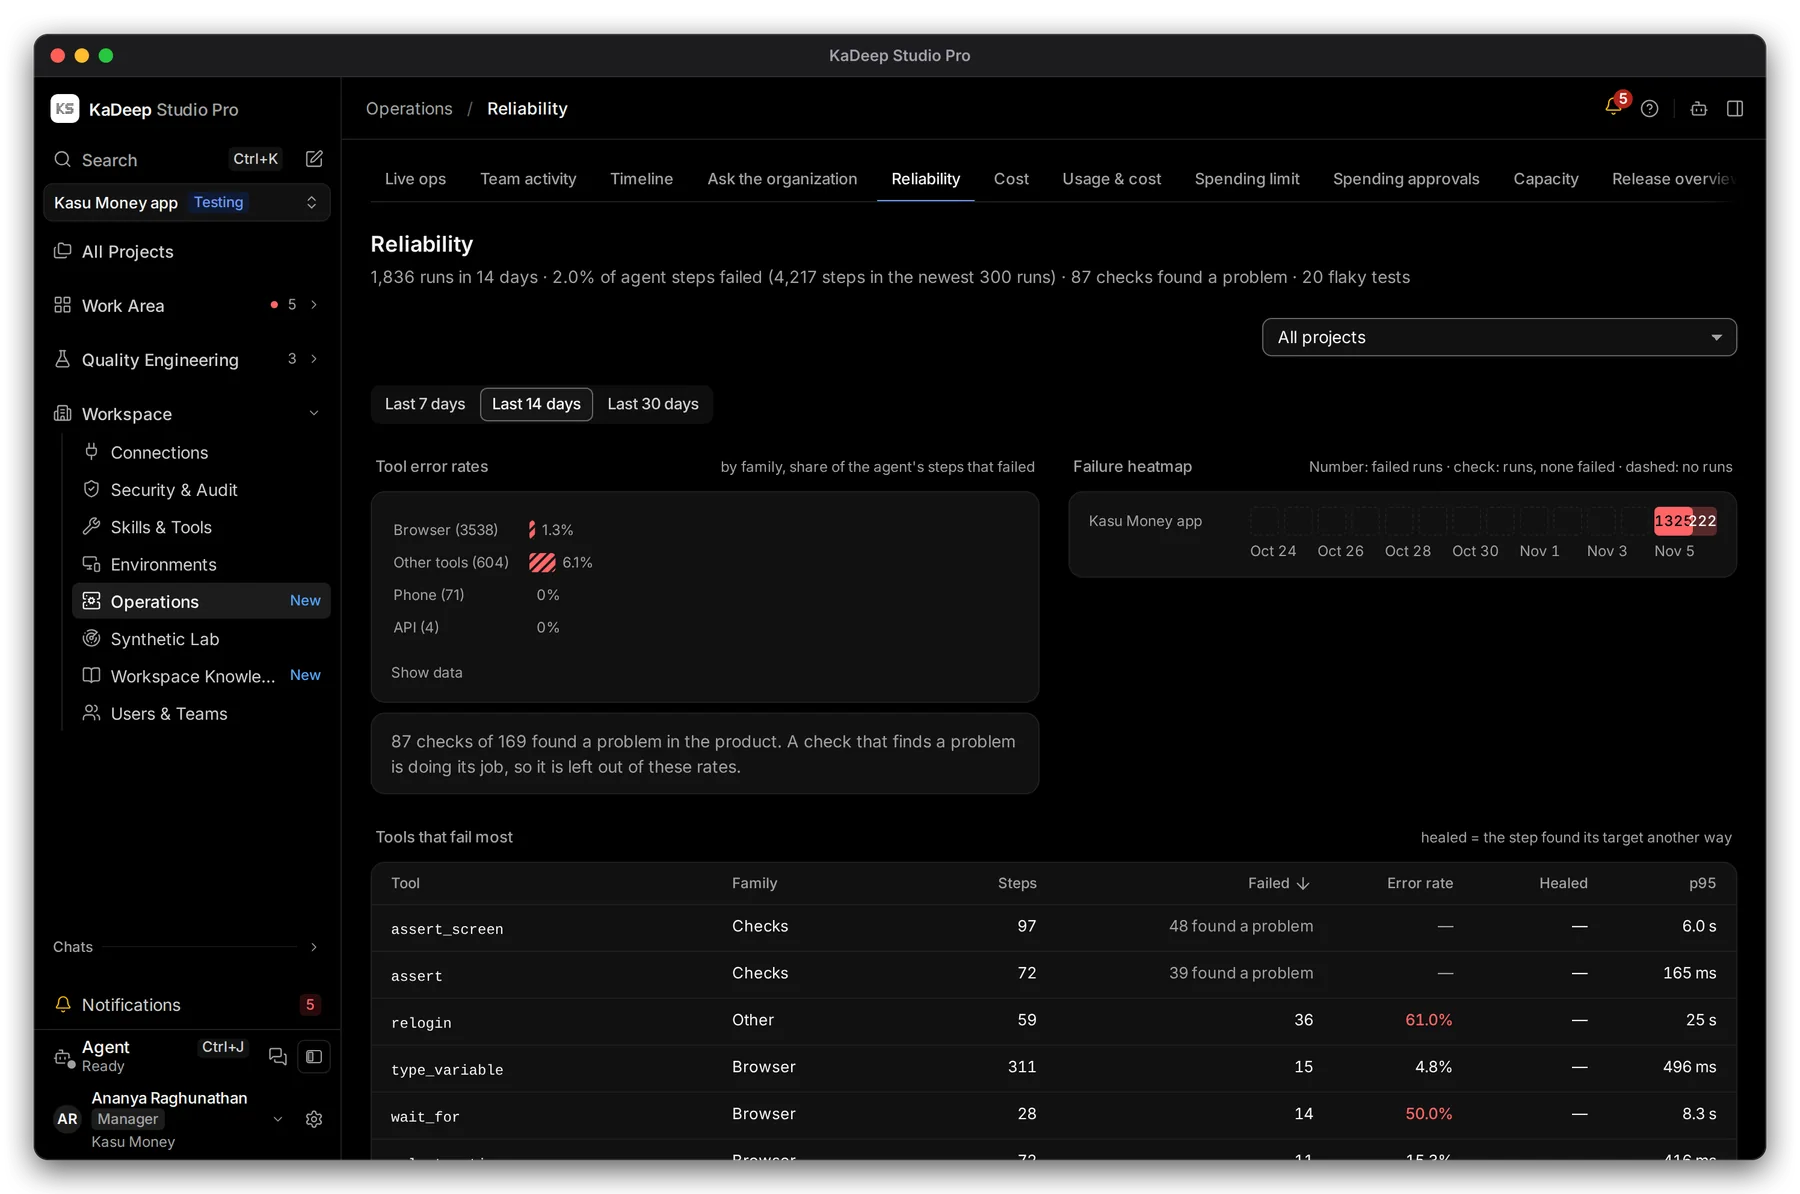
Manage view
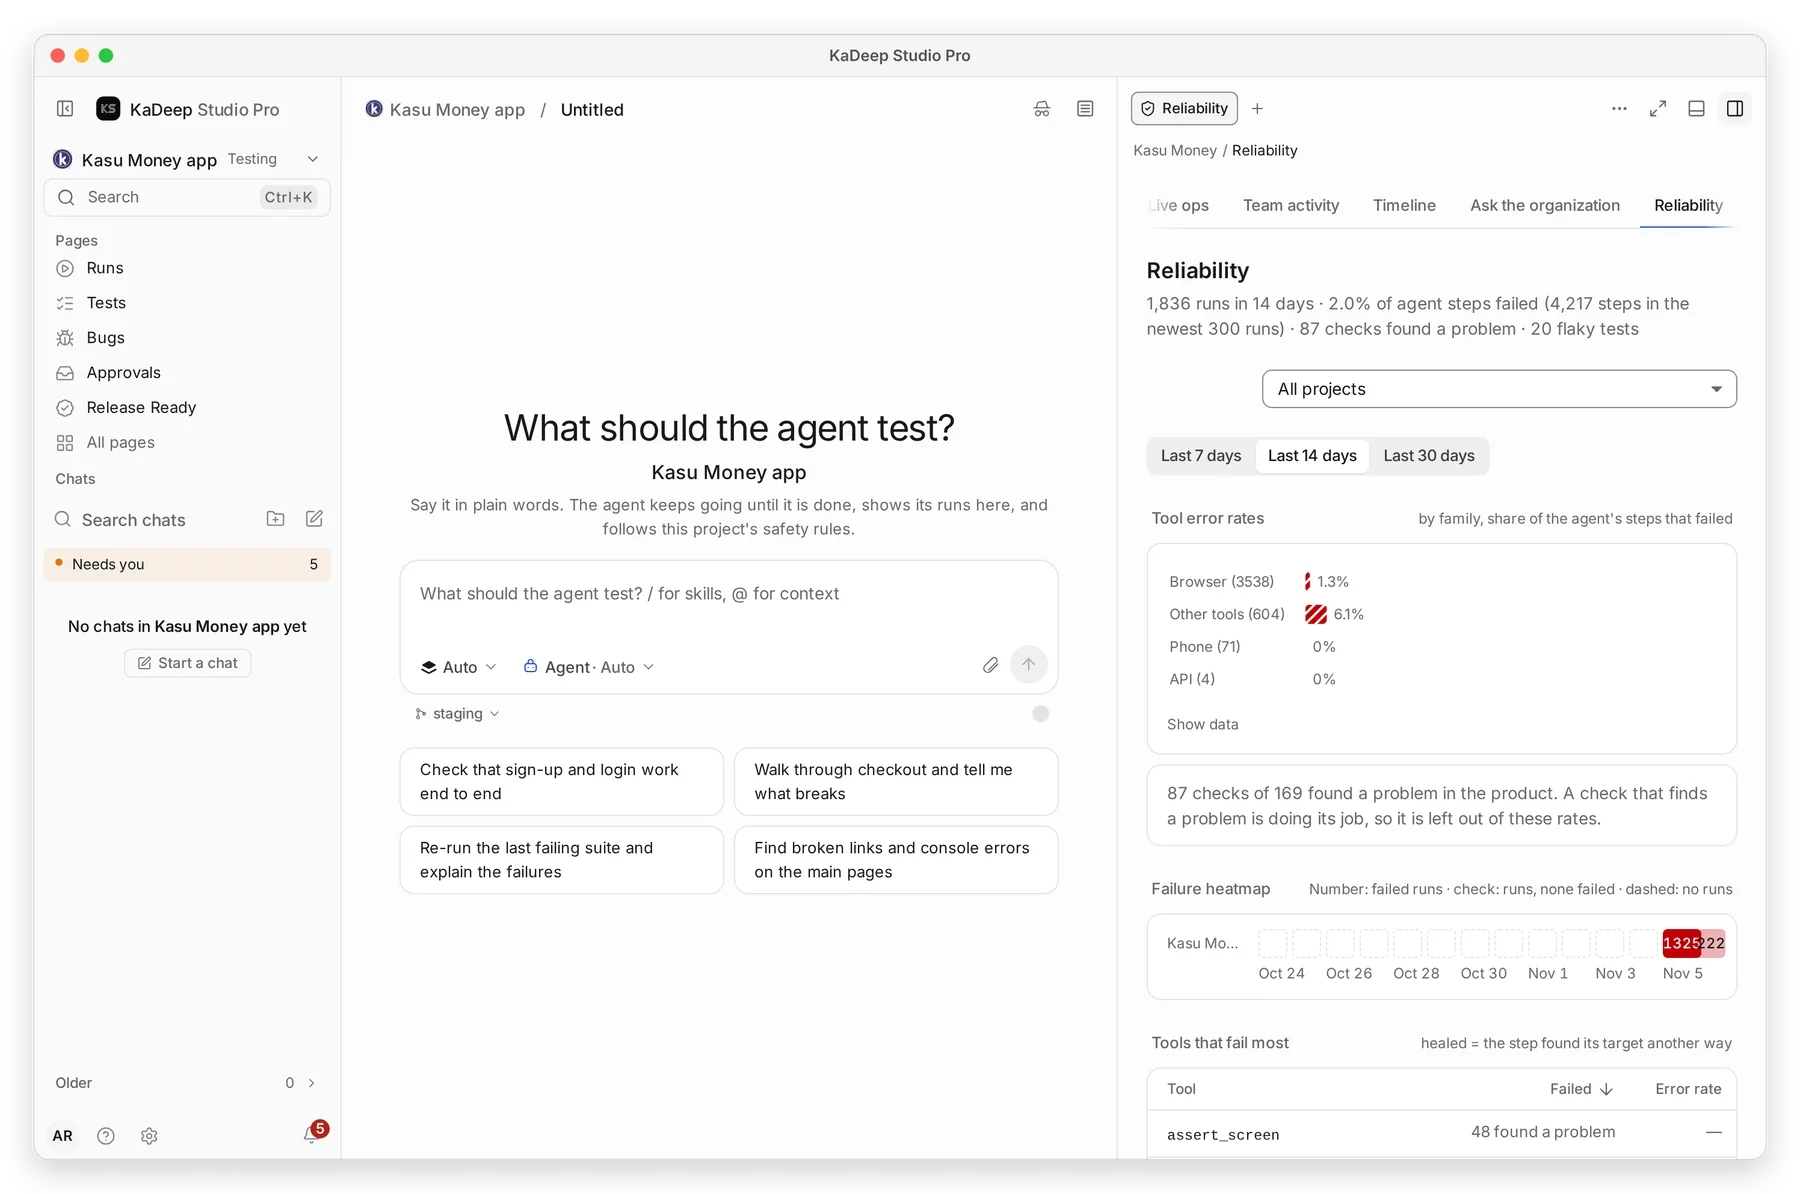
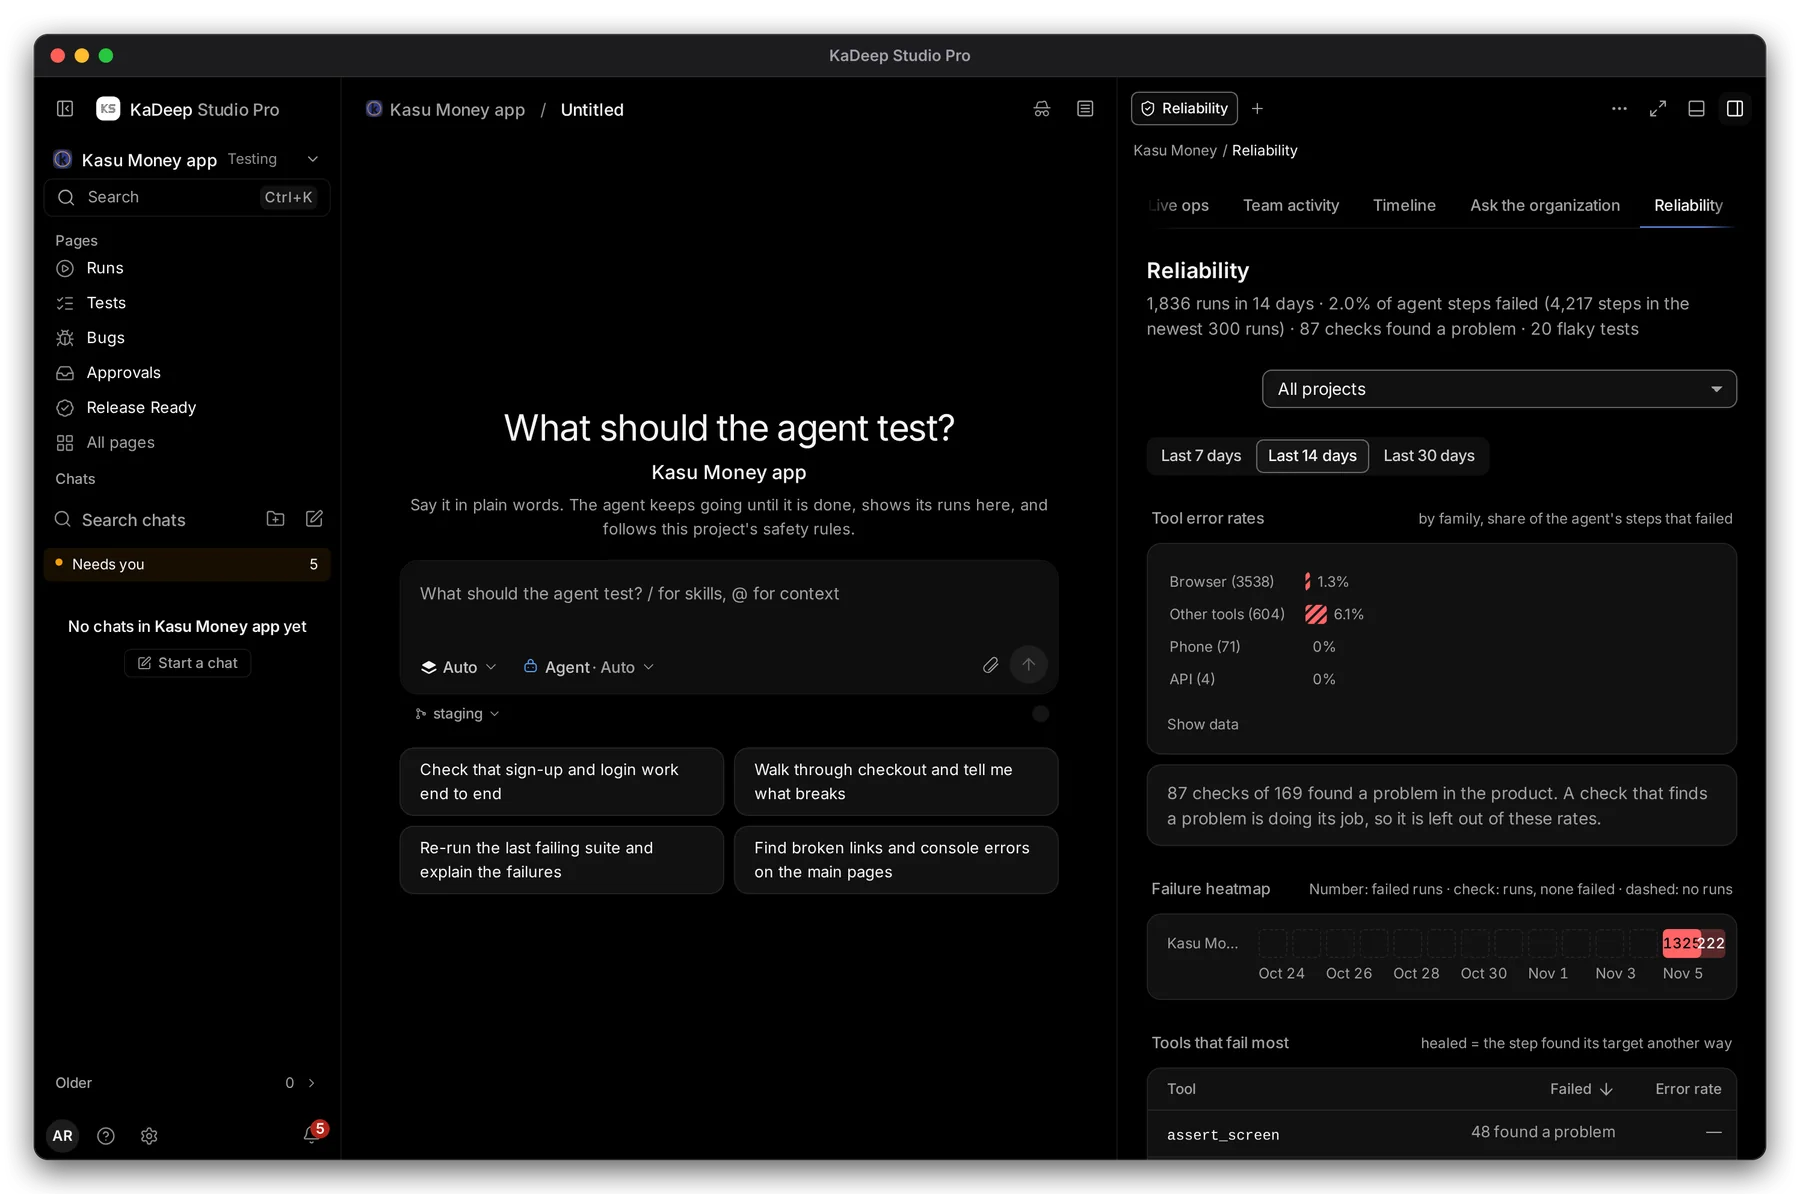
Hands-on view
- 1 The summary: runs in the period, the share of agent steps that failed, checks that found a problem, and flaky tests.
- 2 Tool error rates by family: browser, phone, API and other tools.
- 3 Failure heatmap: failed runs per project per day.
Further down:
| Section | What to do with it |
|---|---|
| Tools that fail most | A high error rate on one tool points to a setup problem, such as a login or a device. Healed counts steps that found their target another way. |
| Slowest tests | Split or speed up the slowest ones, so suites finish sooner. |
| Flaky tests | Tests that pass and fail with no change. File bug to have someone fix the test. |
What’s next
Section titled “What’s next”Synthetic monitorsCheck pages and journeys around the clock.
Team activityWhat people and agents are doing now.
Watch agents liveMission Control, as it happens.
CostWhat runs cost, by project and by person.