Read what runs cost
Your view
Cost answers two questions: what did agent work cost this month, and where did it go? Finance reads it; managers and admins use it to decide where to spend next.
1. Open Cost and pick a period
Section titled “1. Open Cost and pick a period”Open Workspace › Operations › Cost.
Under Pages, choose Cost.
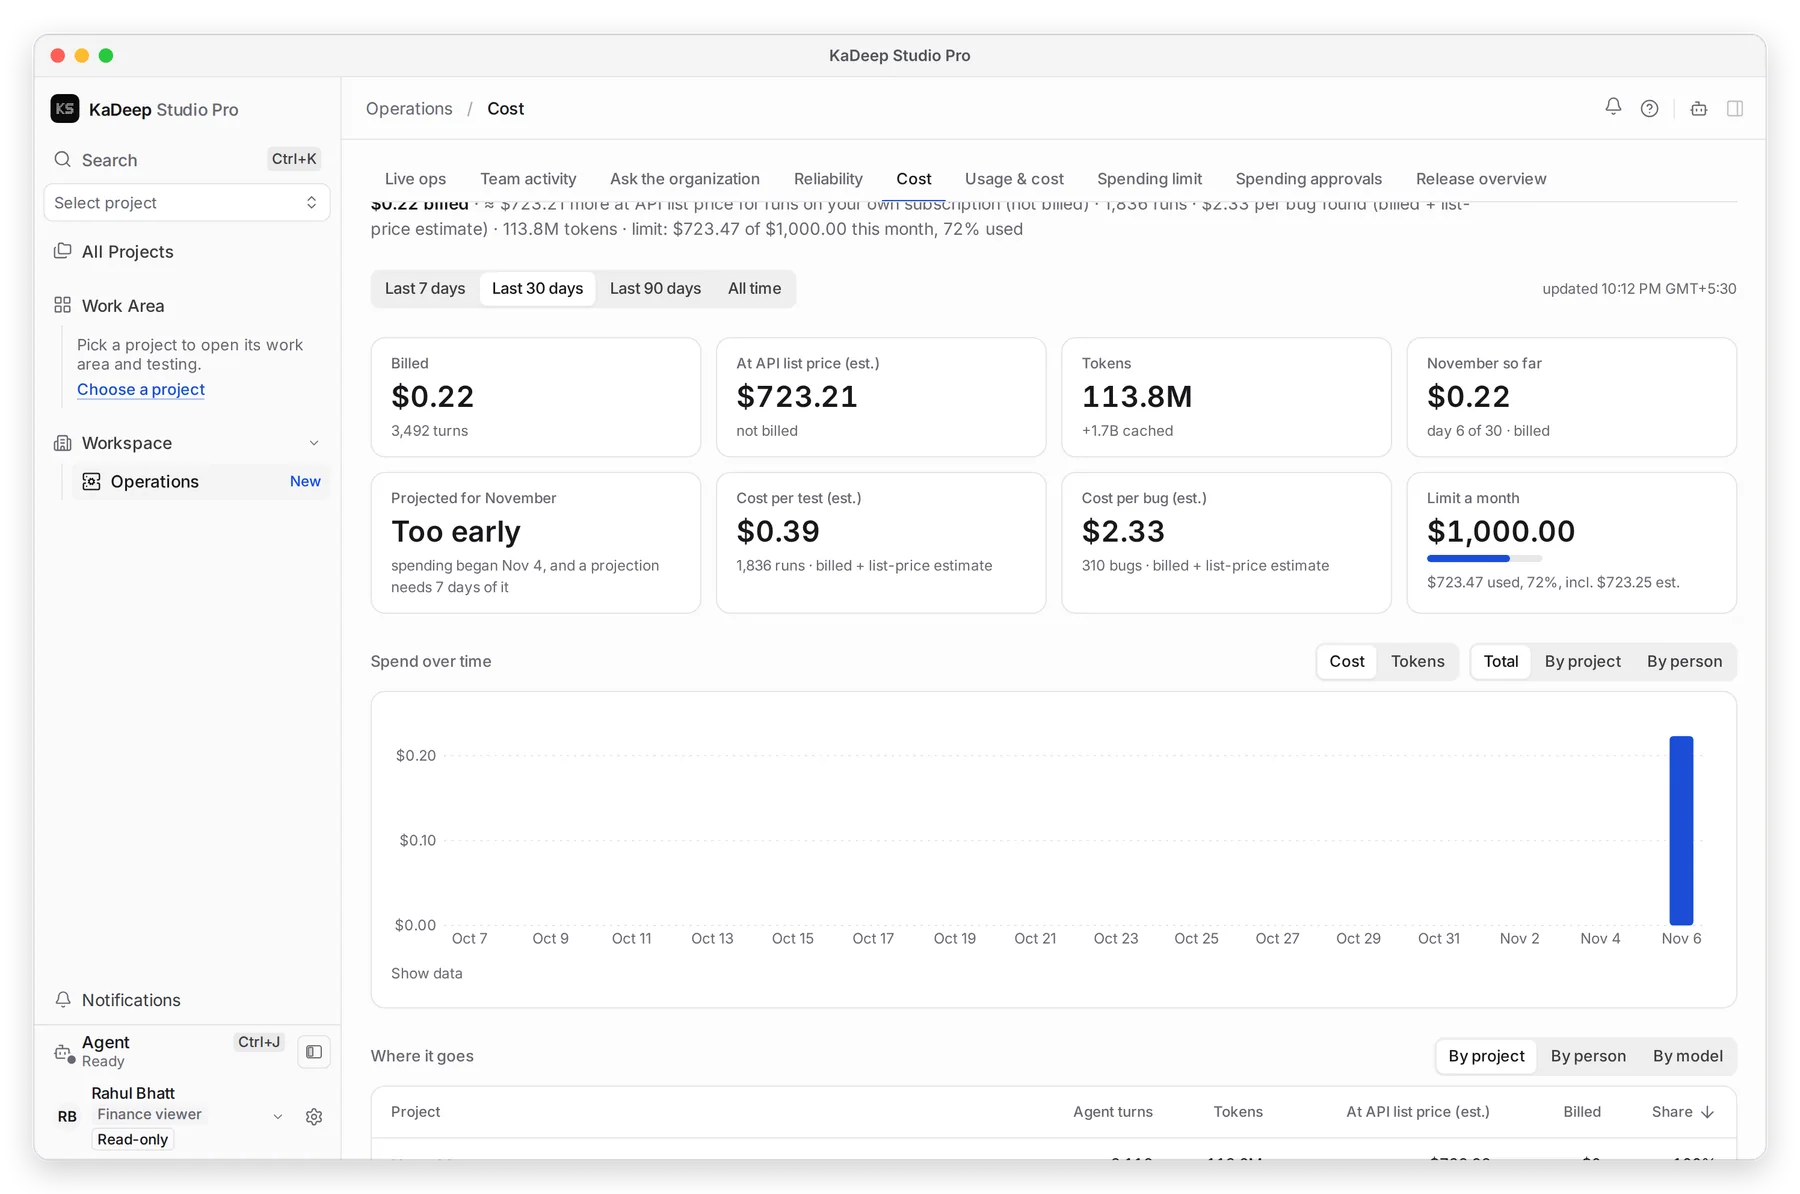
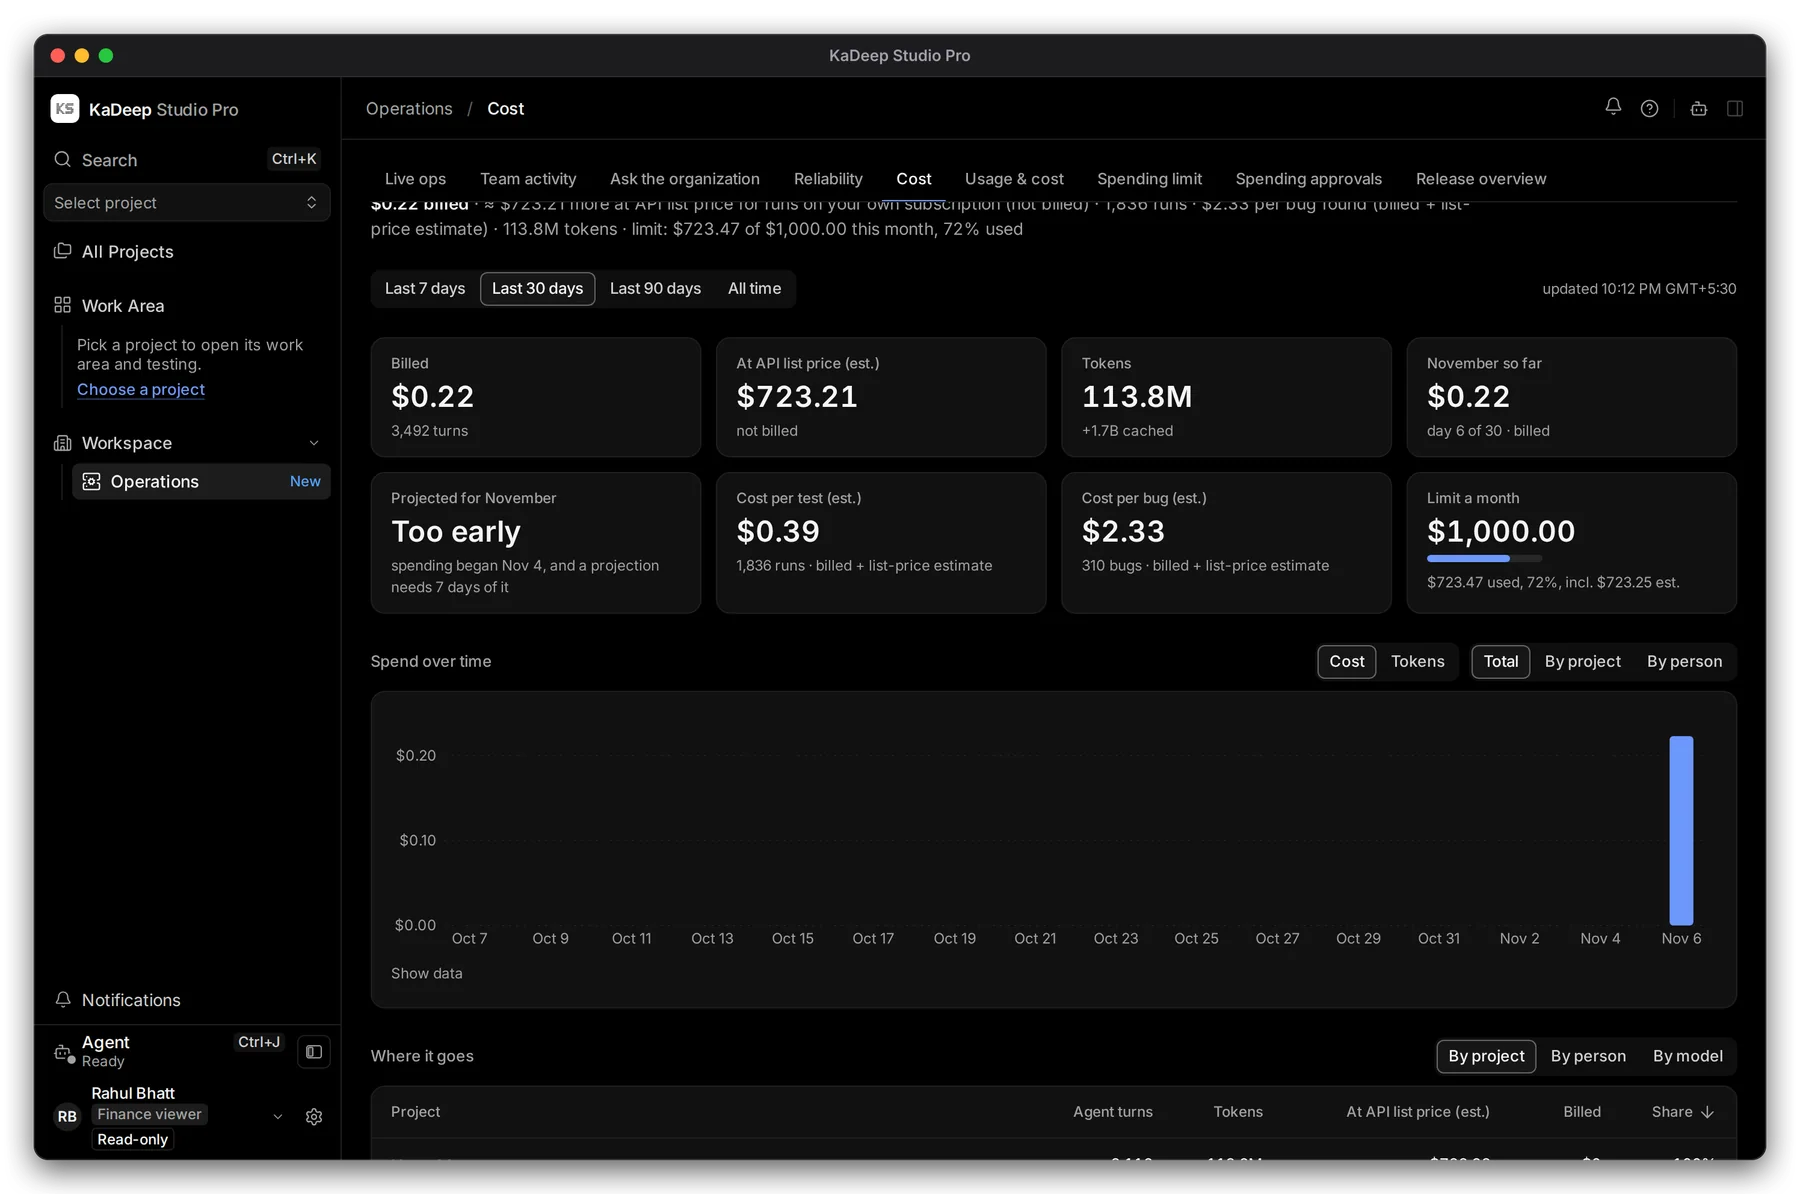
Manage view
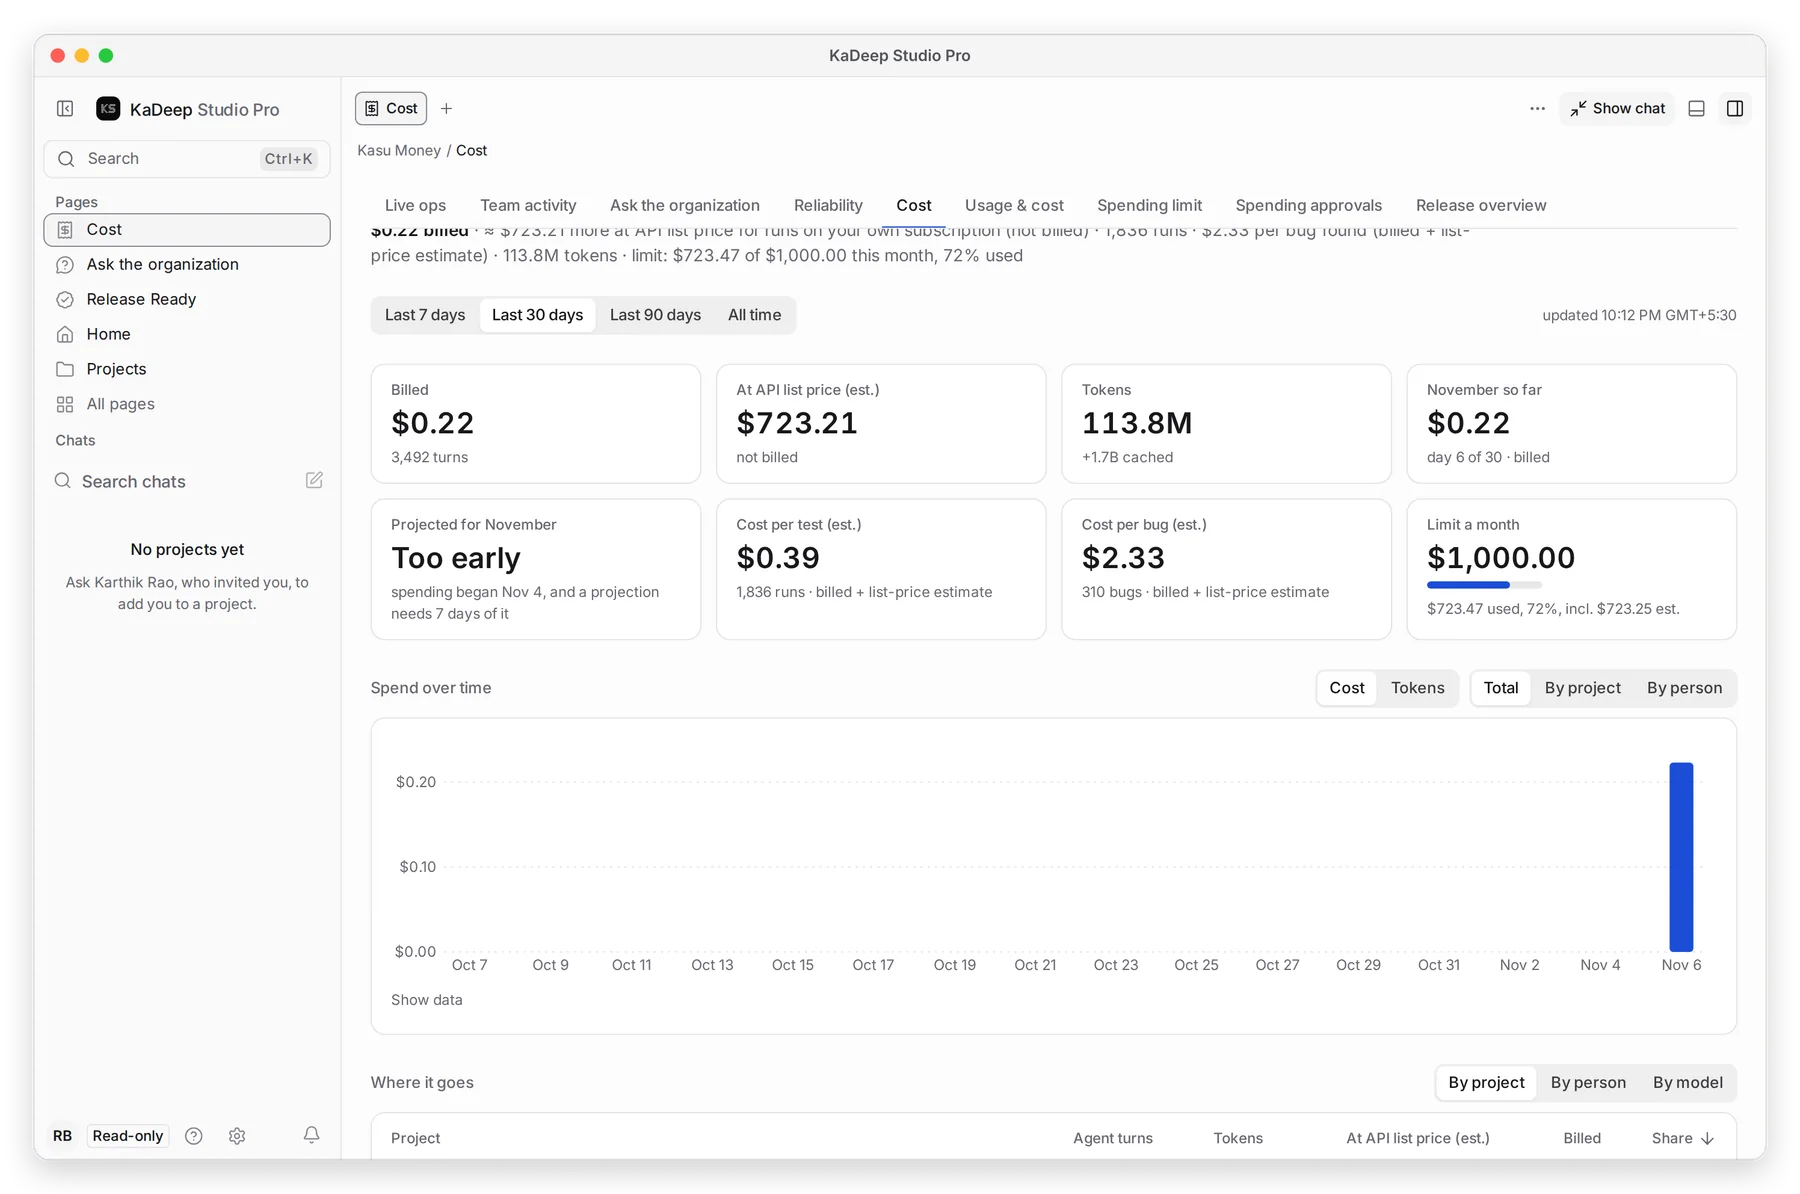
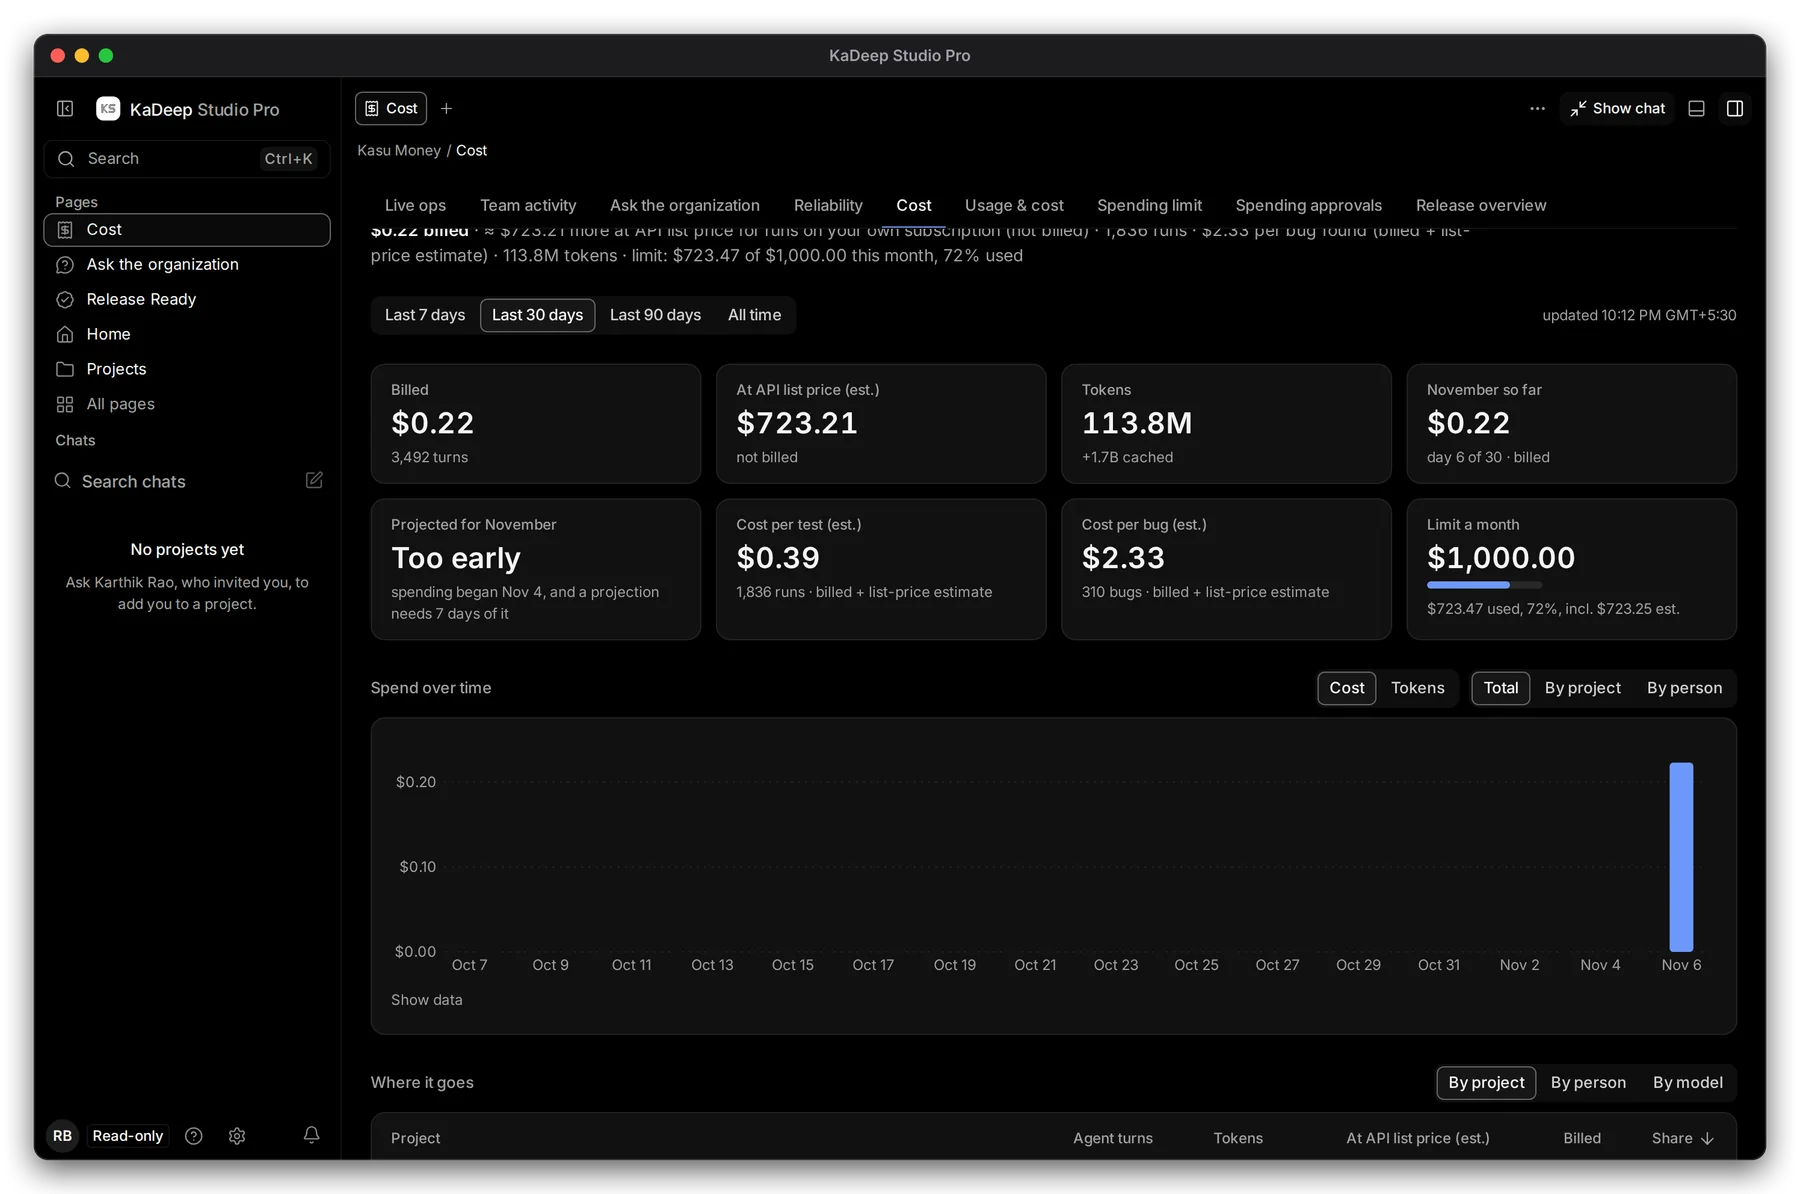
Hands-on view
- 1 The summary line: billed spend, the list-price estimate, runs, cost per bug, tokens and the limit, in one sentence.
- 2 Period: Last 7 days, Last 30 days, Last 90 days or All time.
- 3 The tiles, explained below.
2. Read the tiles
Section titled “2. Read the tiles”| Tile | What it shows |
|---|---|
| Billed | What KaDeep billed for agent work in the period, and how many agent turns |
| At API list price (est.) | What runs on your own AI provider subscription would cost at list price. Not billed by KaDeep. |
| Tokens | Tokens the agents used, plus cached tokens |
| November so far | This calendar month, billed. Months close in your organization’s time zone. |
| Projected for … | The month-end forecast. It needs 7 days of spend; before that it says Too early. |
| Cost per test (est.) | Spend divided by runs |
| Cost per bug (est.) | Spend divided by bugs found |
| Limit a month | The monthly limit, and how much of it is used |
3. See where it goes
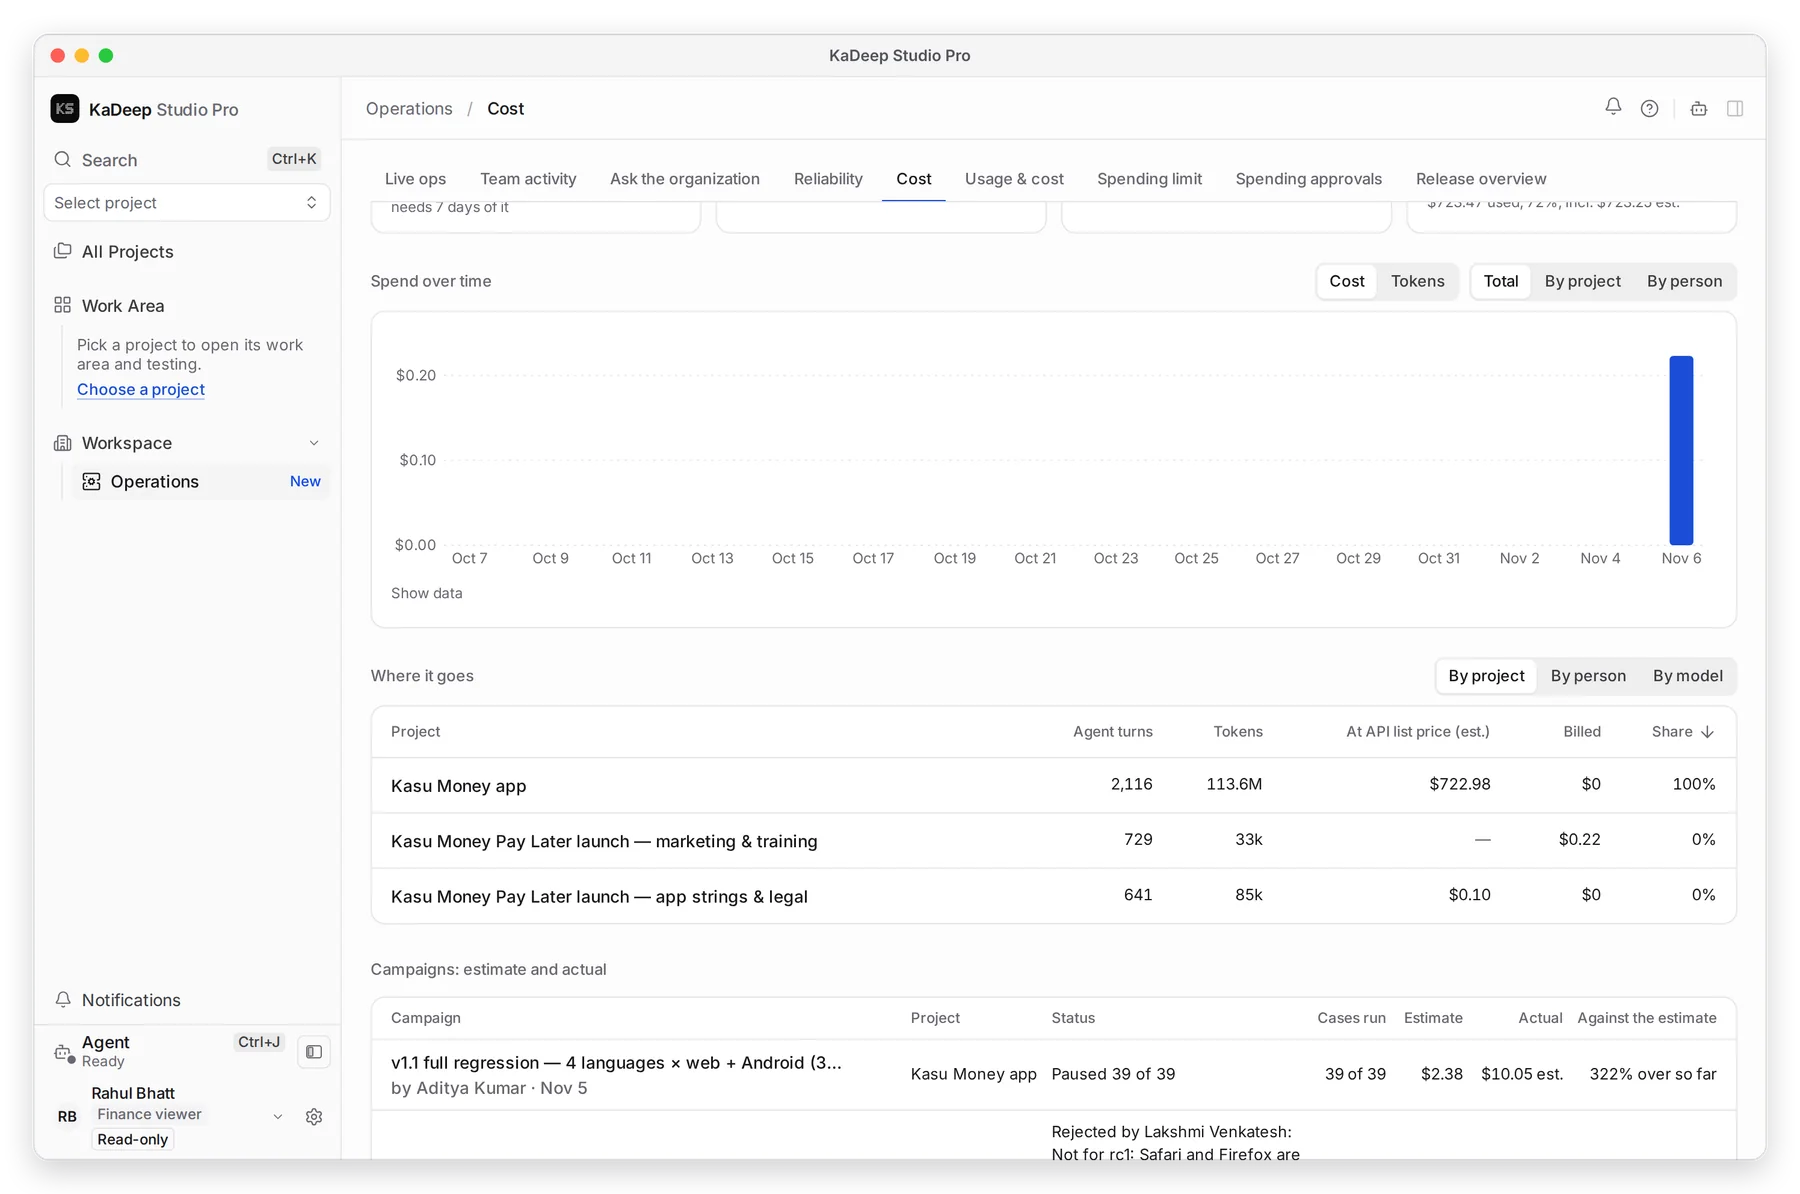
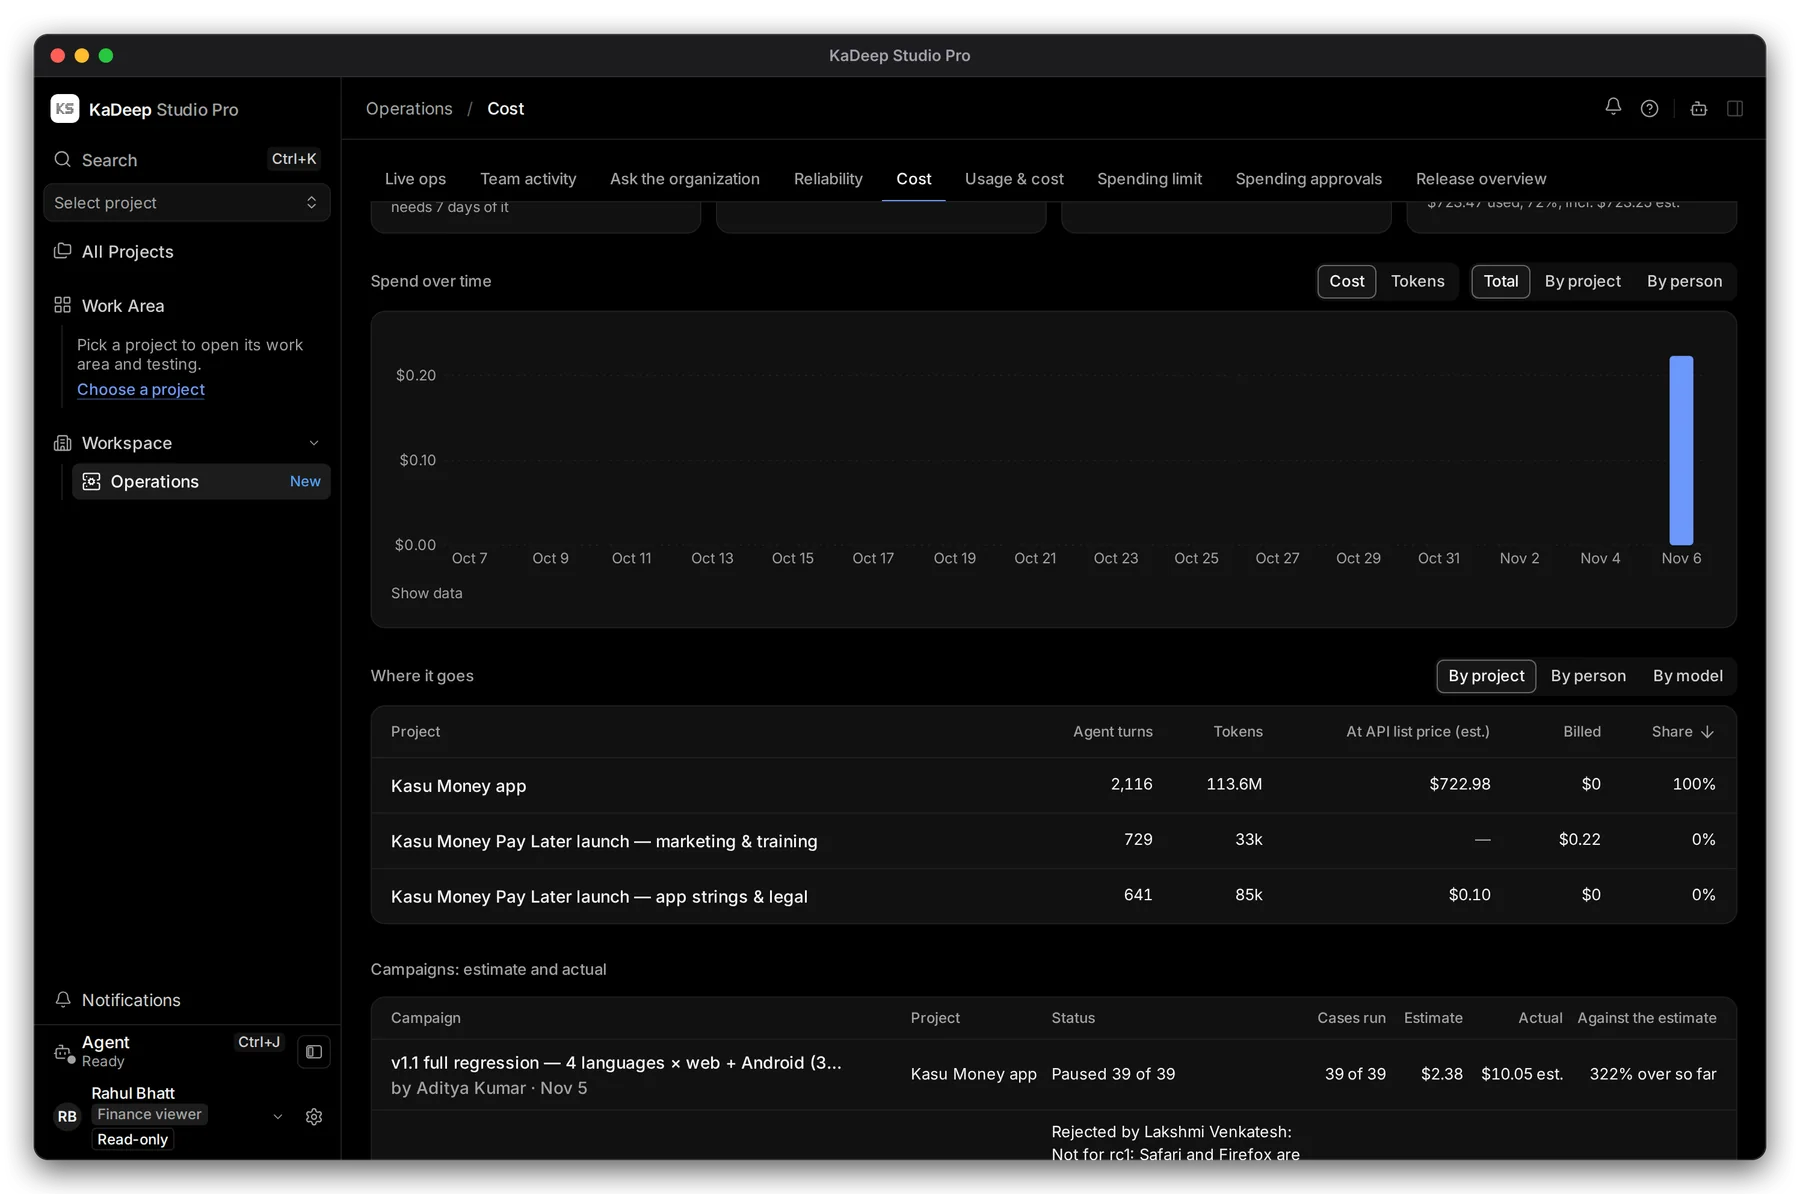
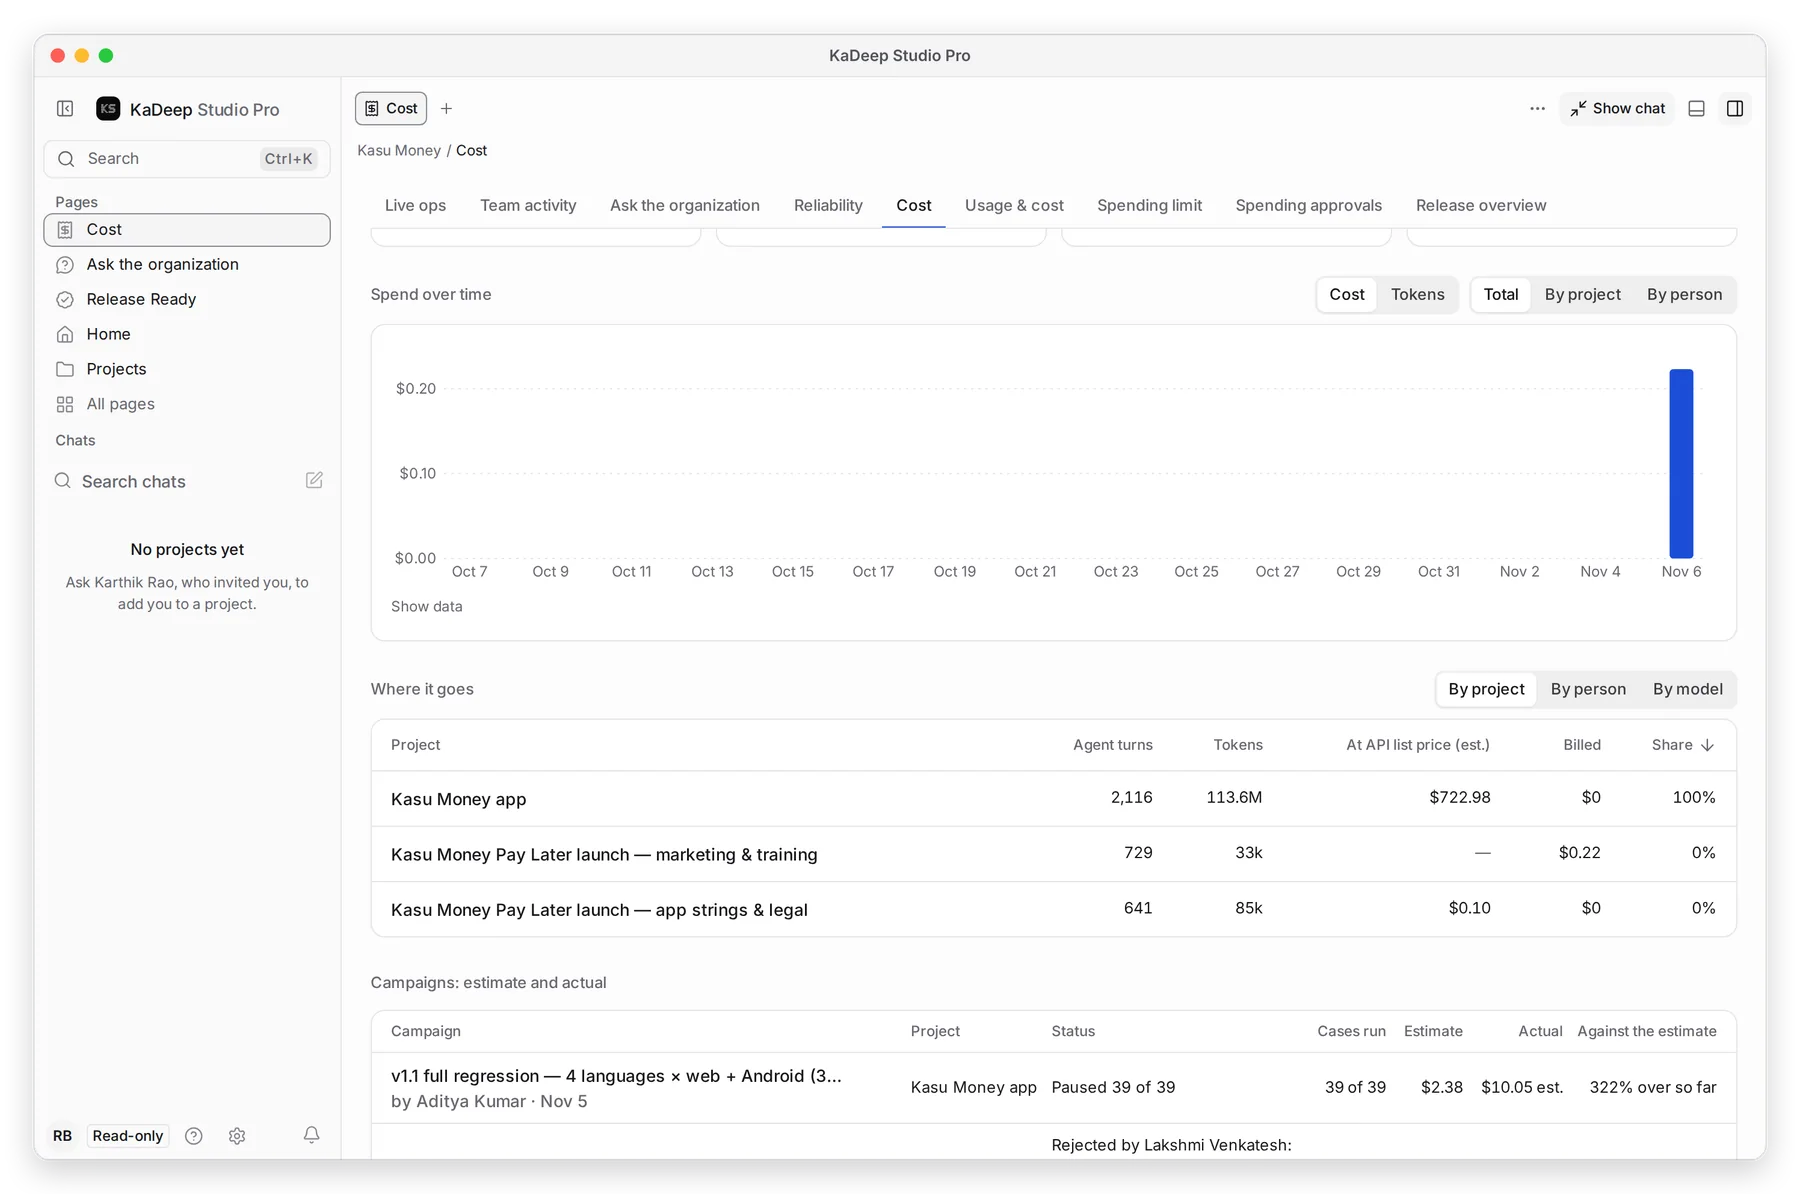
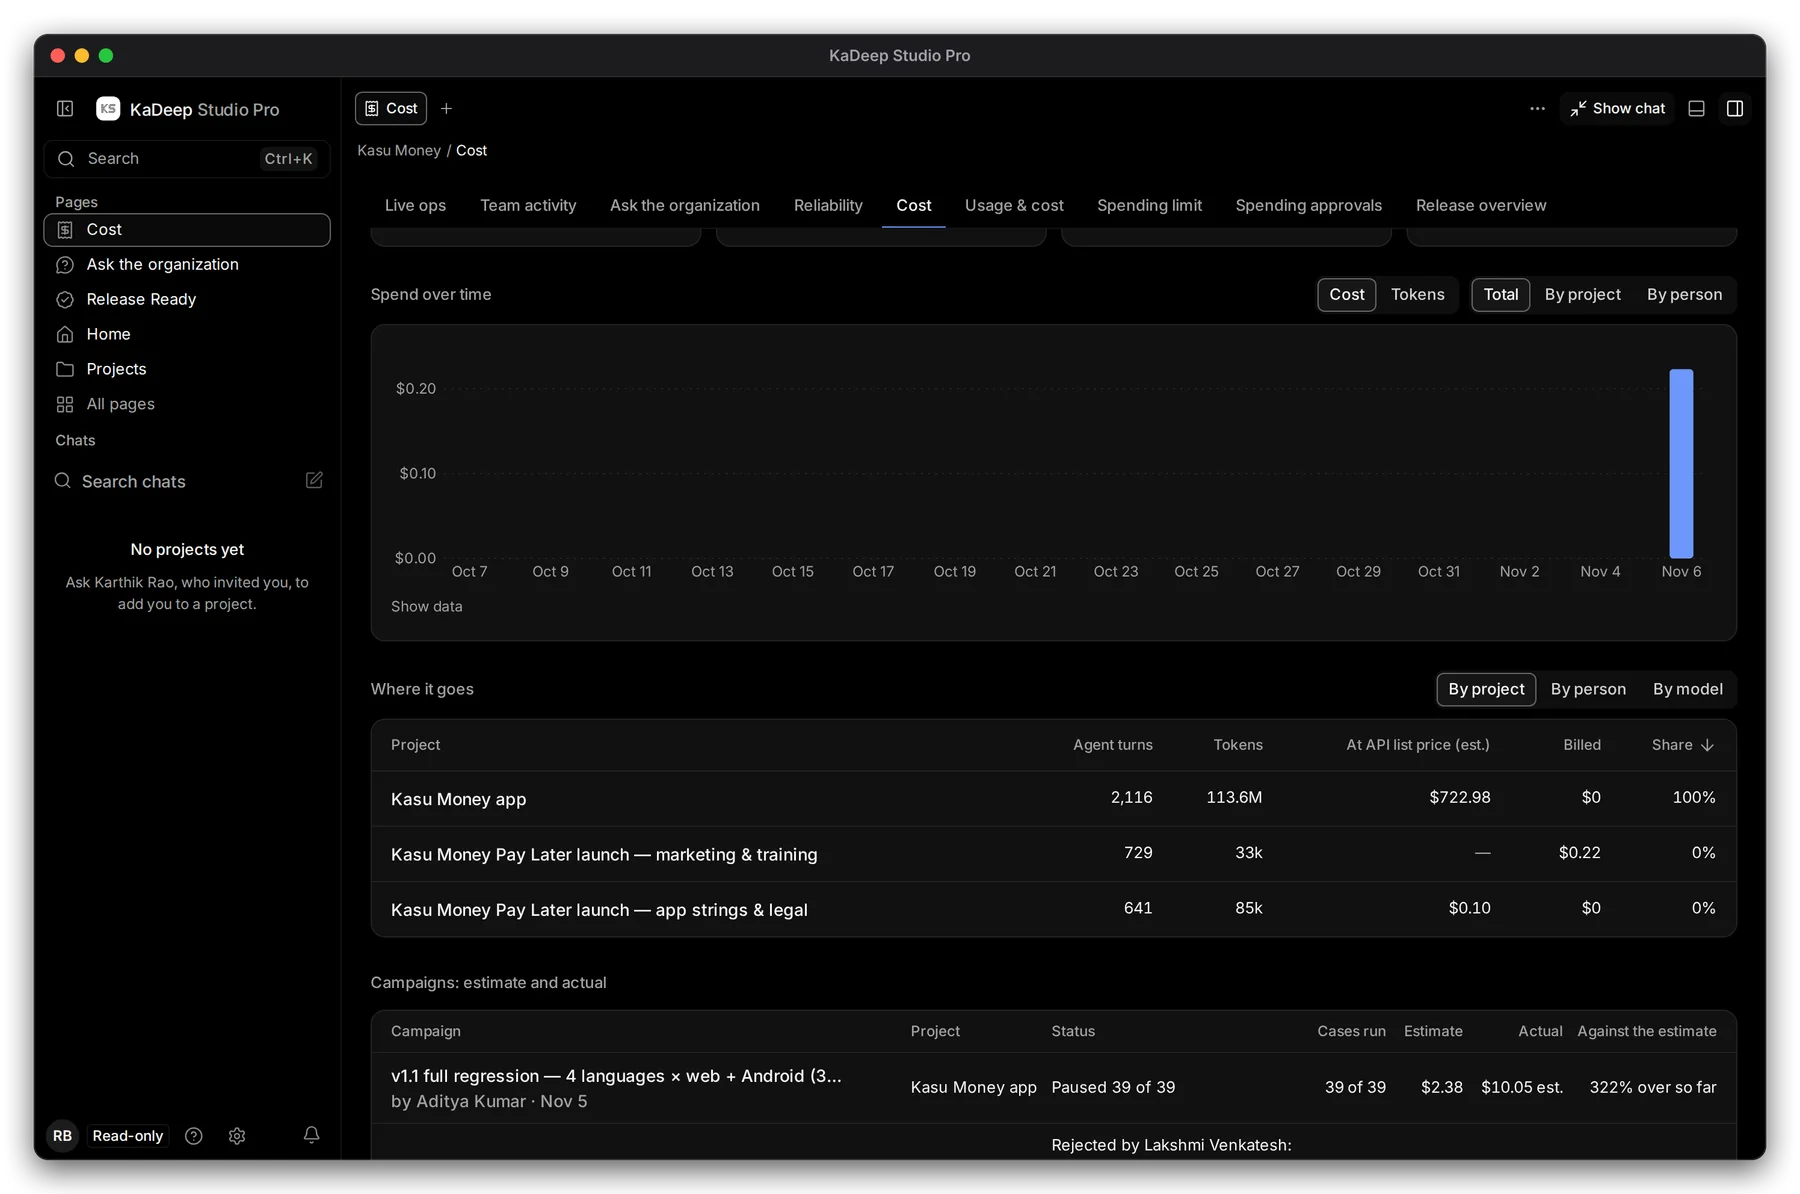
Section titled “3. See where it goes”Scroll down to Spend over time and Where it goes.
Manage view
Hands-on view
- 1 Where it goes: a table of agent turns, tokens, list price, billed and share.
- 2 Switch between By project, By person and By model.
- 3 Campaigns: estimate and actual: each large run that needed approval, what it was expected to cost, and what it did cost.
- To compare months, choose All time, then read Spend over time.
- To check one project, choose By project and read its row.
- To share the numbers, open More and download the CSV.
What’s next
Section titled “What’s next”Usage over timeSpend per day, and the top people, projects and models.
Spending limitsThe monthly limit and who signs spending.
Ask the organization“What did each project cost this week?”