Follow spend over time
Your view
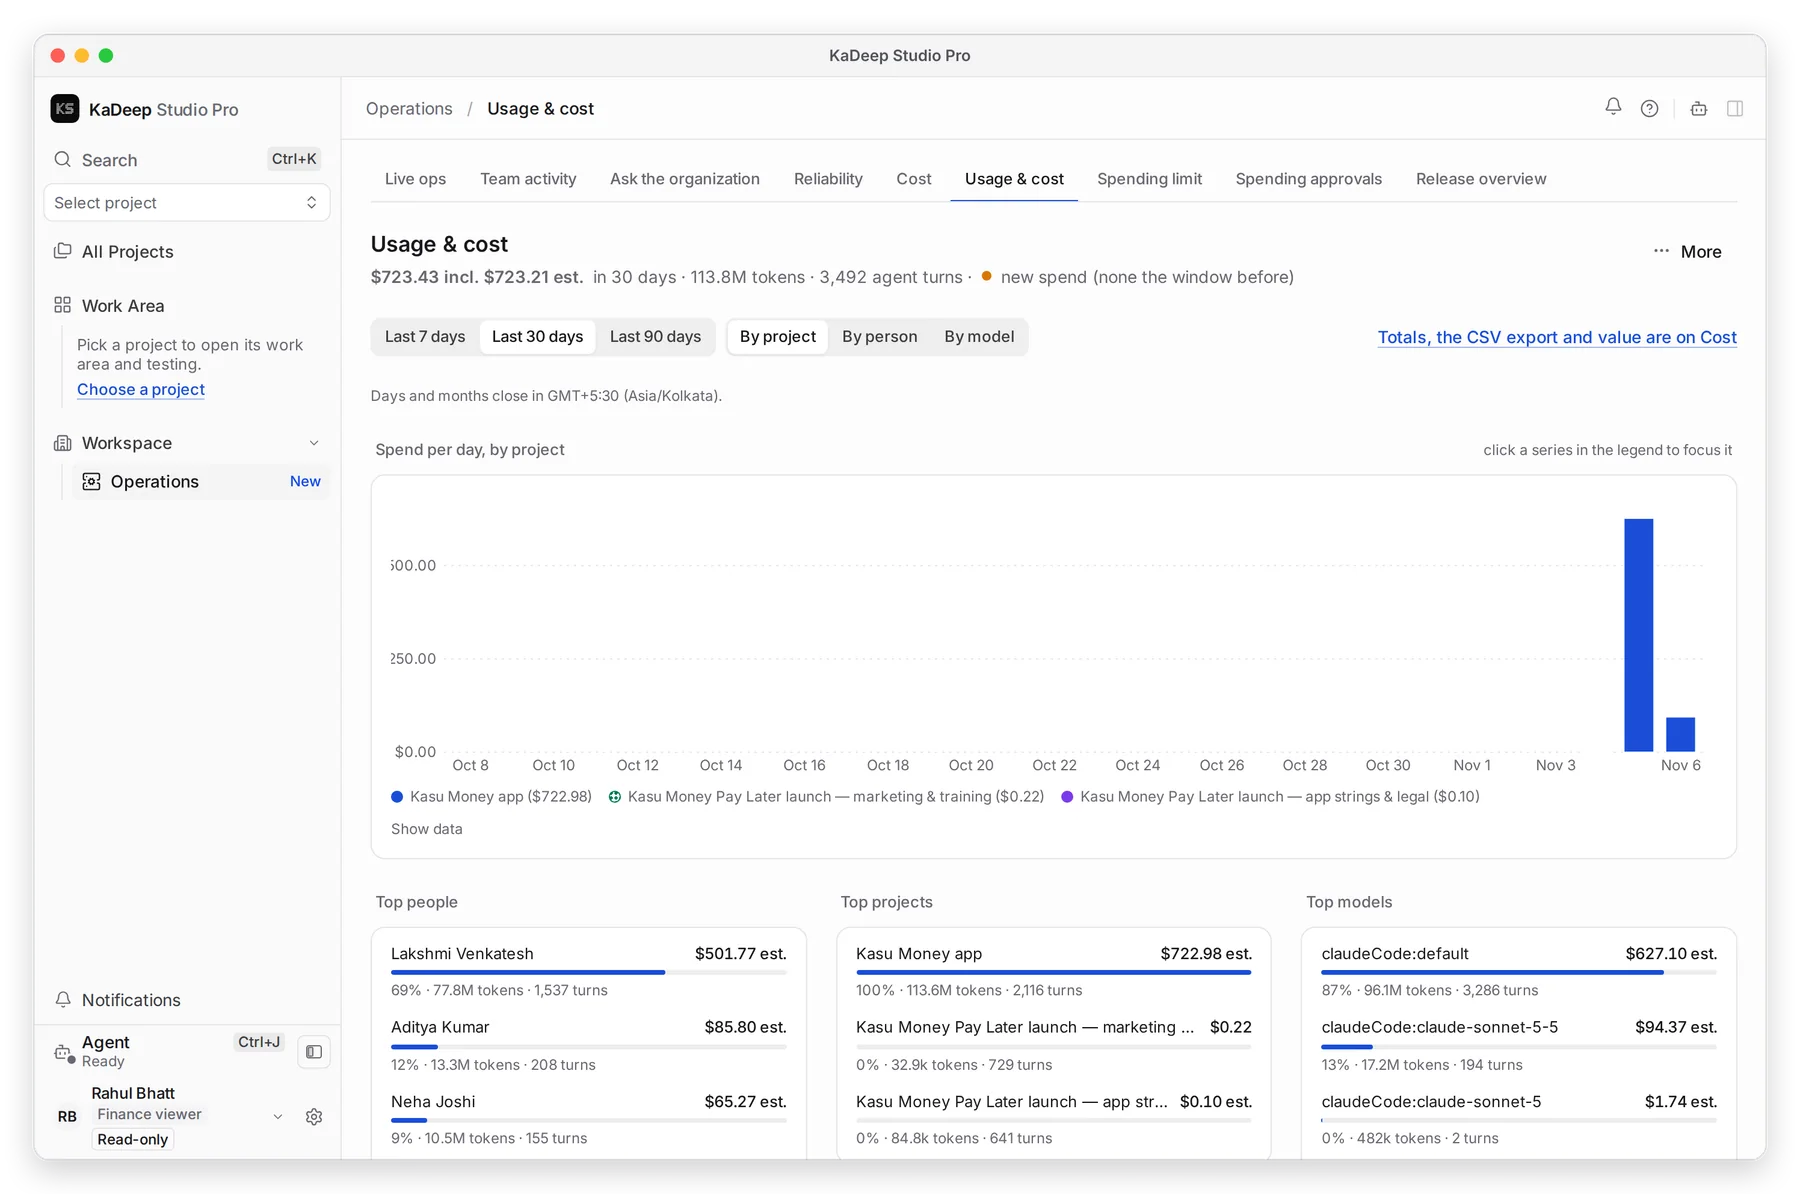
Usage & cost shows how spend moves day by day, and who or what drives it. Use it when the monthly number surprises you.
1. Open Usage & cost
Section titled “1. Open Usage & cost”Open Workspace › Operations, then the Usage & cost tab.
Under Pages, choose All pages, then Usage & cost.
Manage view
Hands-on view
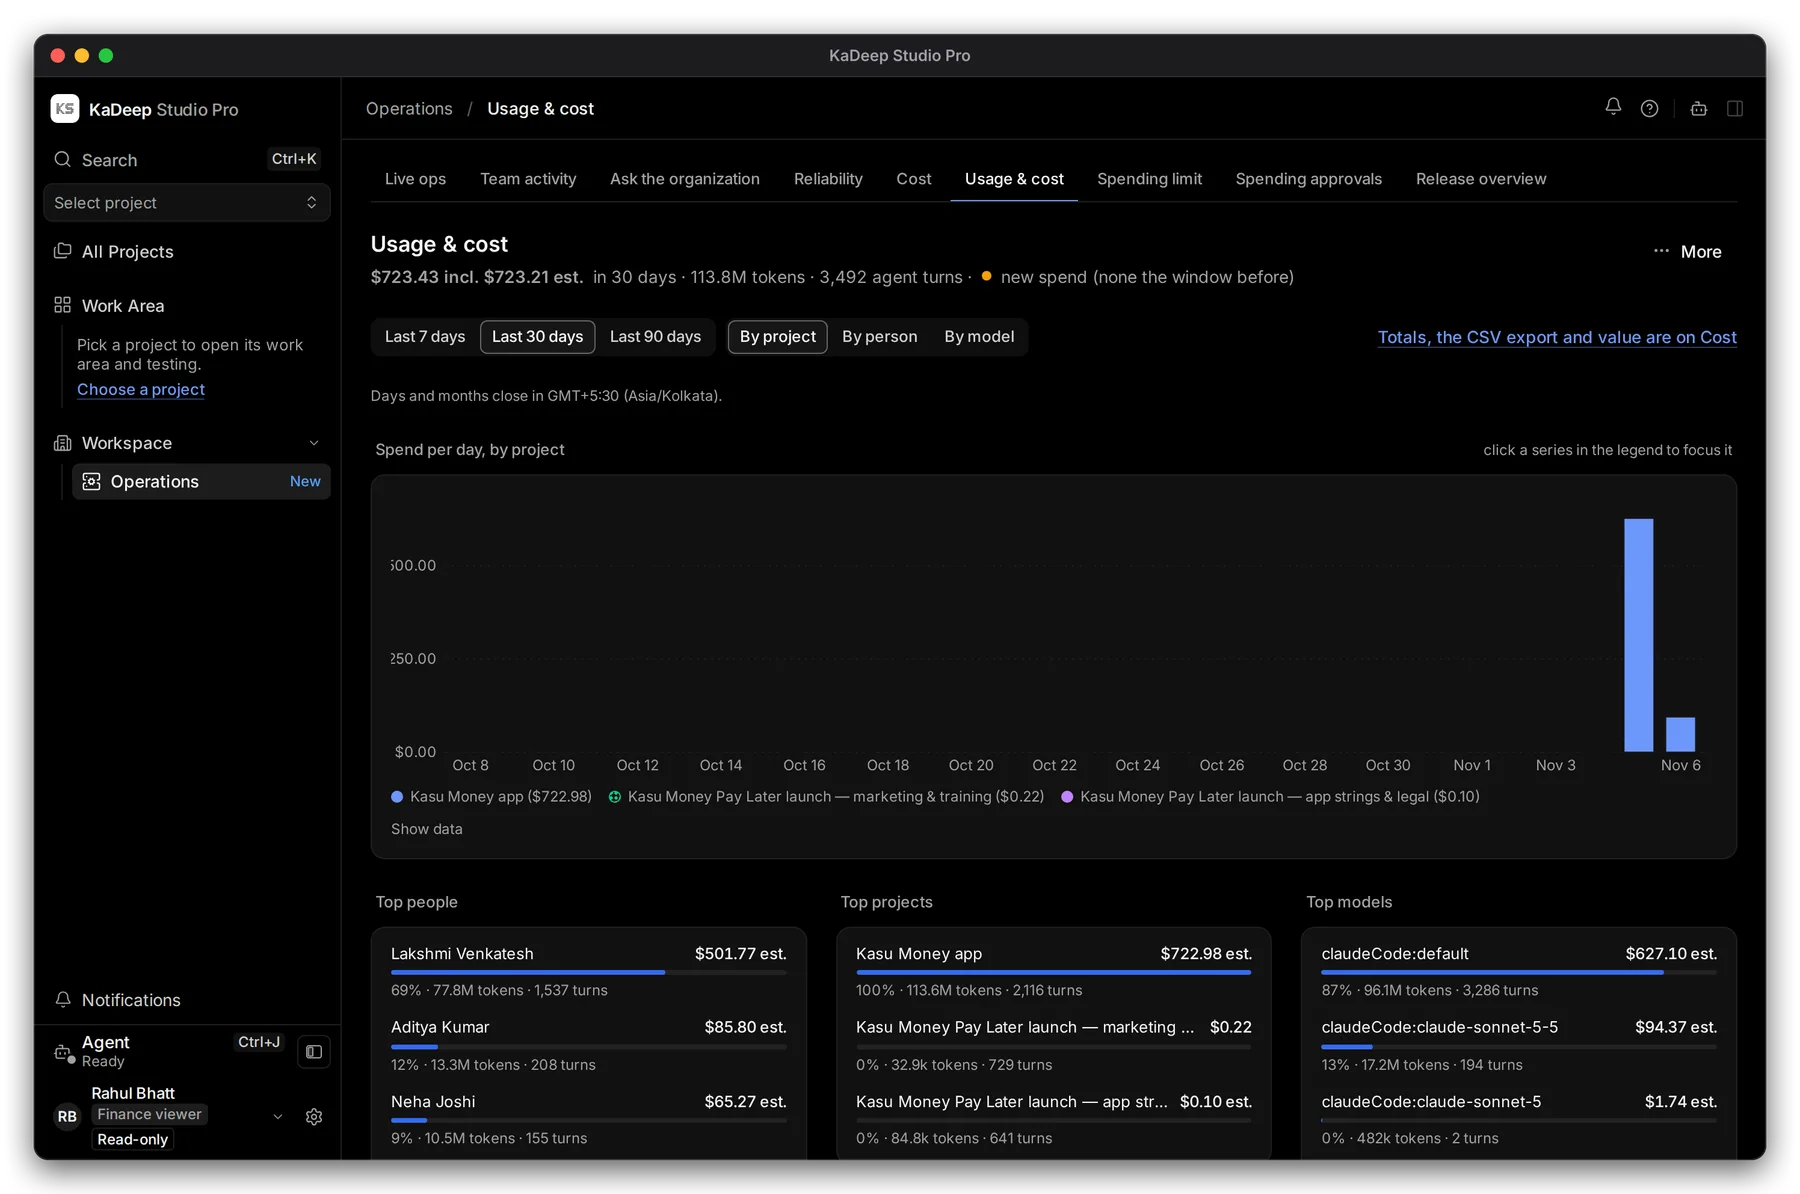
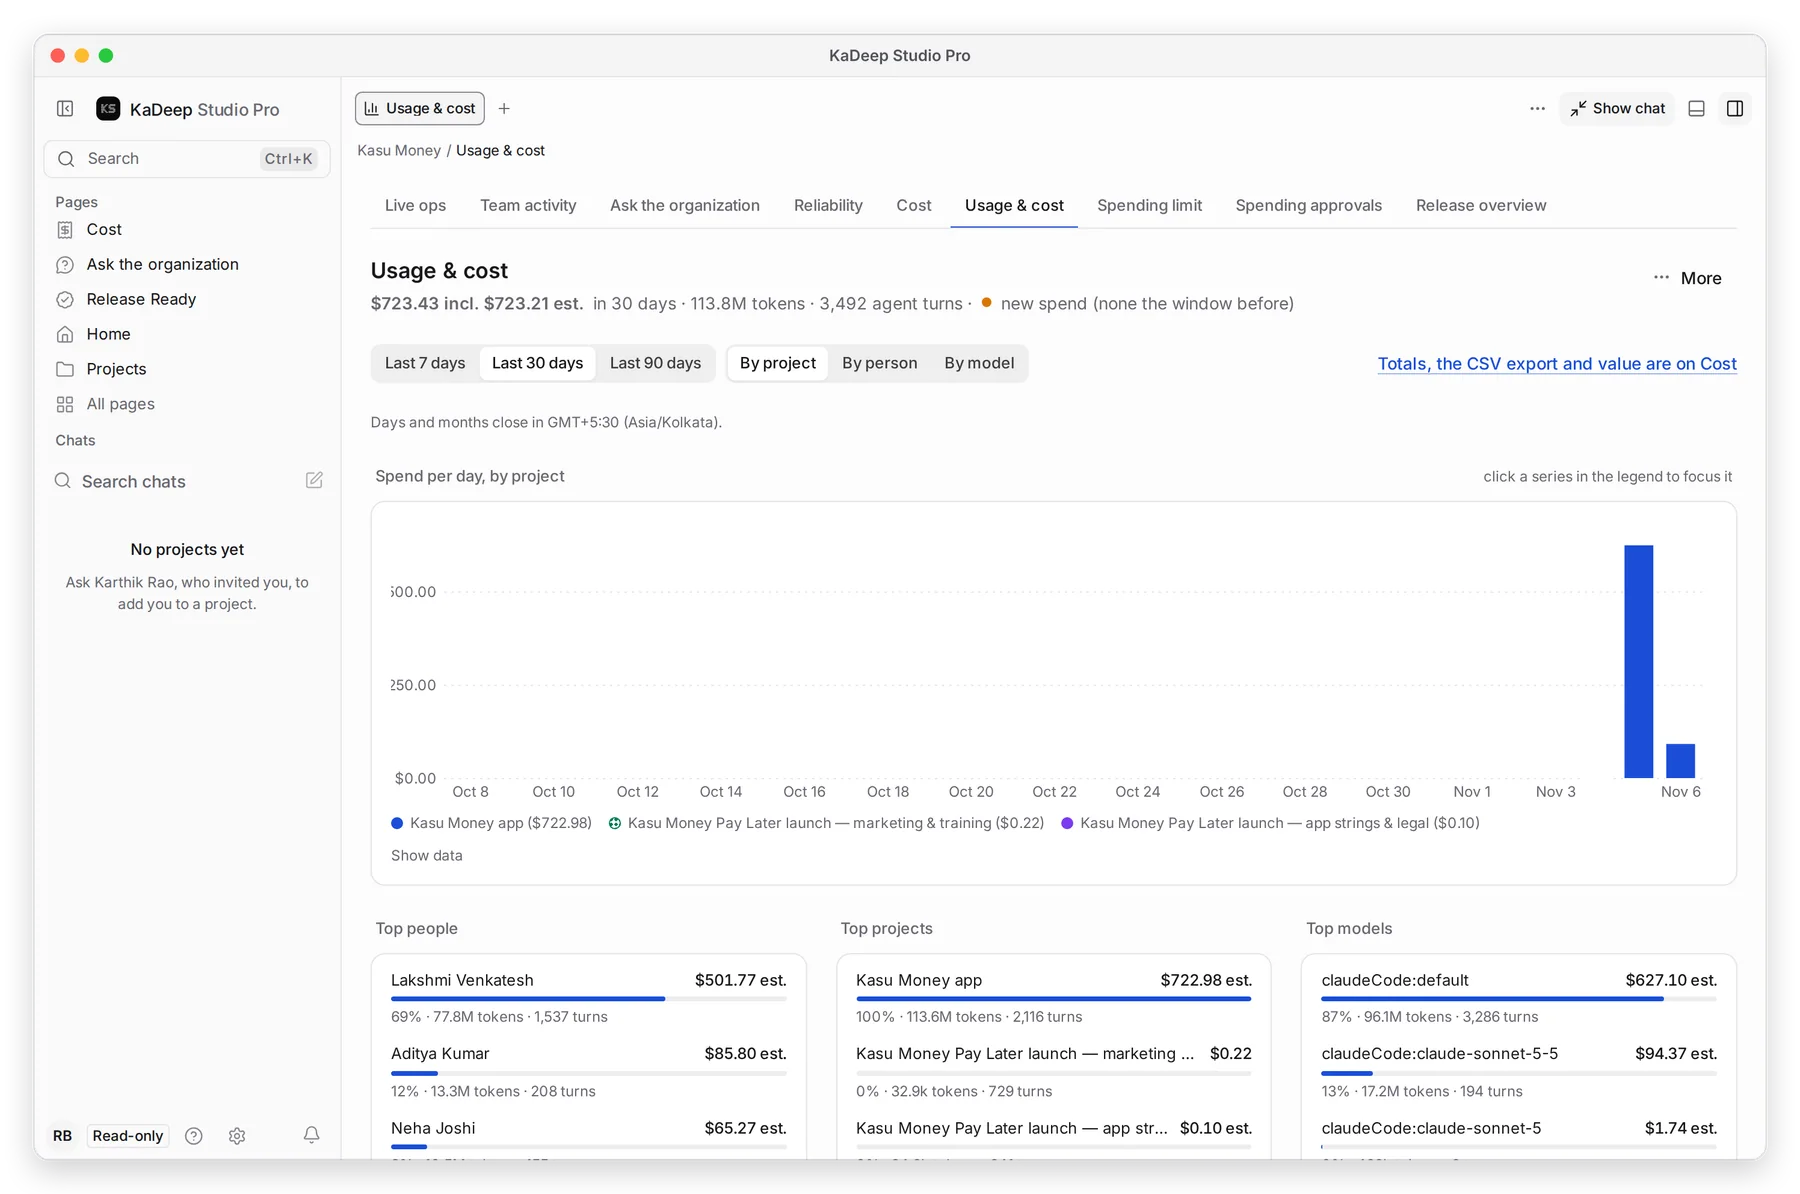
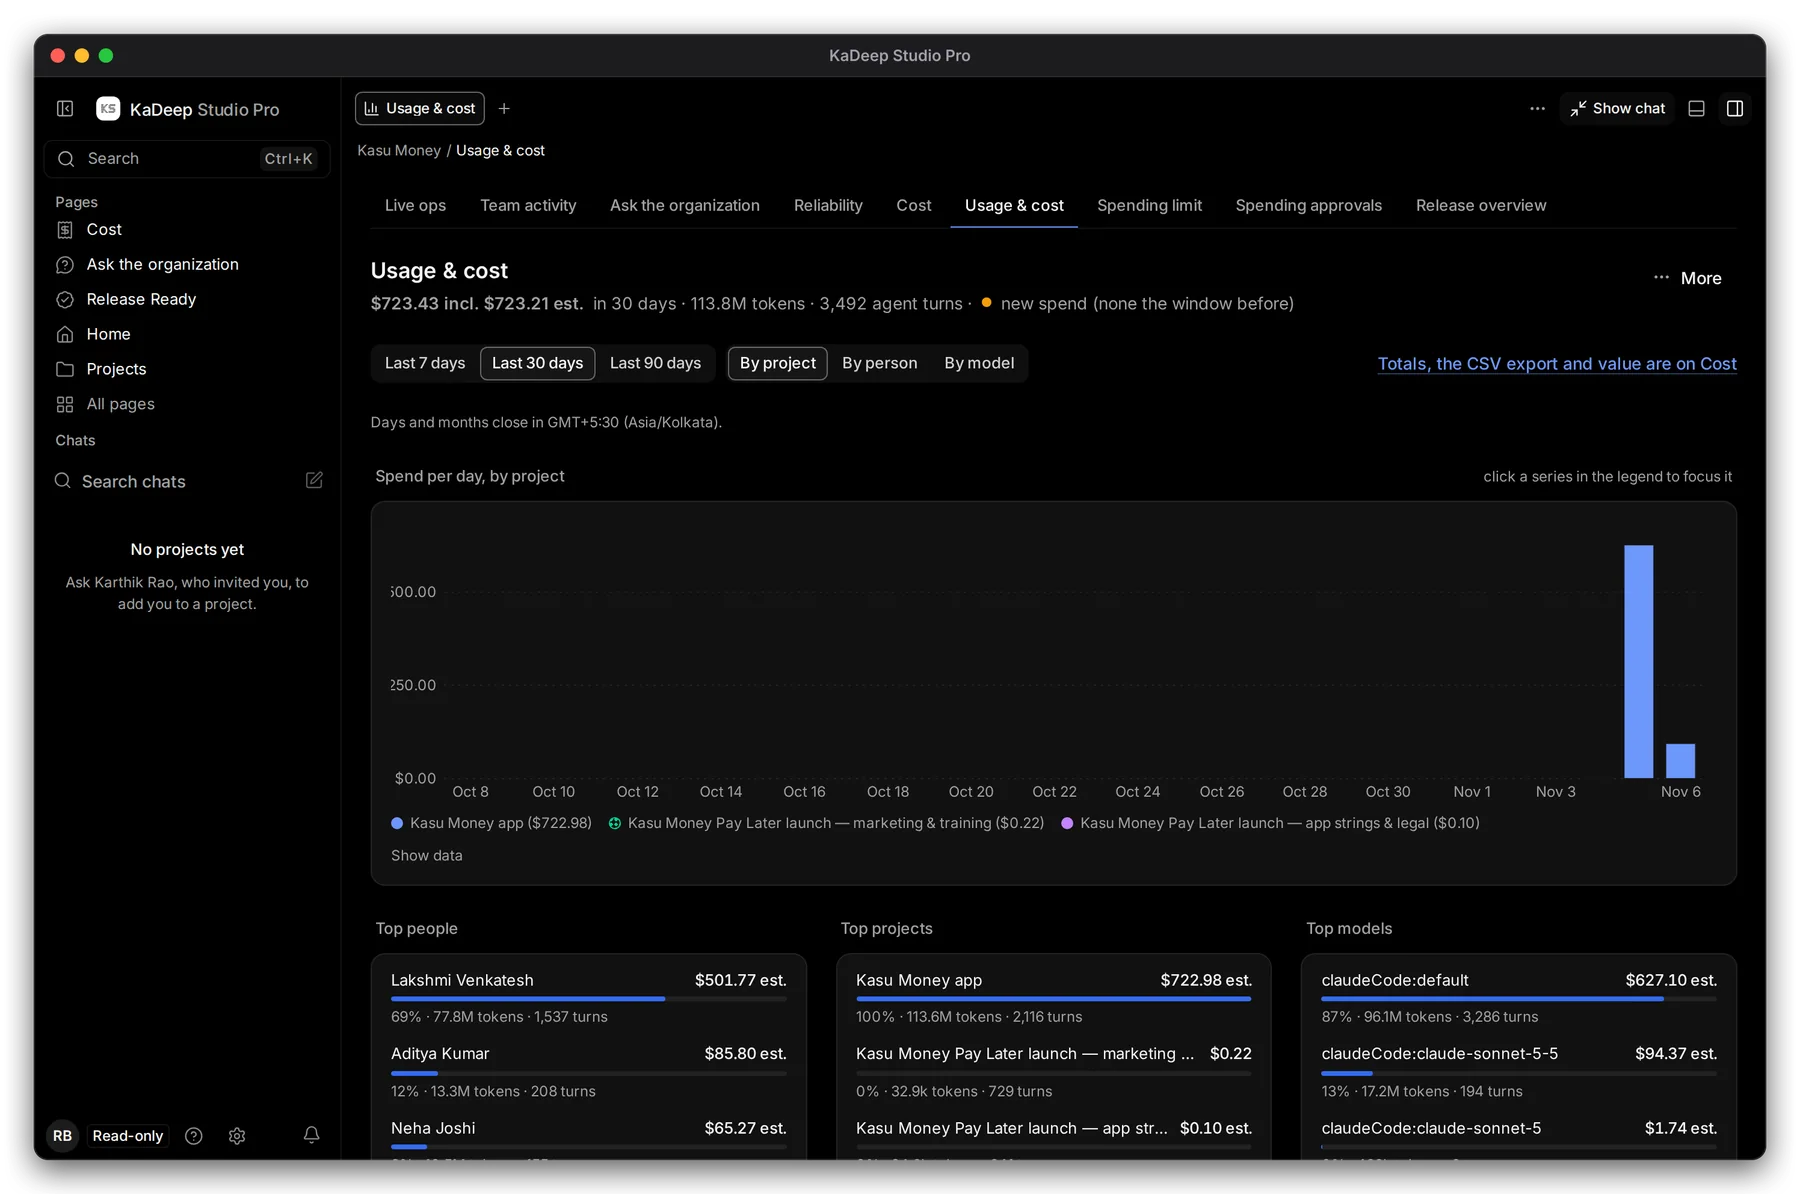
- 1 Period: the last 7, 30 or 90 days.
- 2 Group by: By project, By person or By model.
- 3 Spend per day. Click a series in the legend to focus on it. Show data shows the numbers as a table.
- 4 Top people, Top projects and Top models, each with its share, tokens and agent turns.
2. Find what changed
Section titled “2. Find what changed”- Look for a tall day in the chart.
- Switch Group by to By person to see who ran the work.
- Switch to By model to see whether a larger model was used.
- Open Cost for the same period to see the campaigns behind it.
| You see | What it means |
|---|---|
| est. after an amount | A list-price estimate for work on your own AI subscription, not a bill |
| new spend (none the window before) | Nothing was spent in the previous period, so there is no comparison |
| An amount with incl. … est. | Billed spend plus the estimate |
What’s next
Section titled “What’s next”CostTotals, cost per test and per bug, the CSV.
Spending limitsWhat happens at the limit.
Finance at a glanceYour daily check.